So you're filtering from pbmc.markers into top10.
This call here:
top10 <- pbmc.markers %>% group_by(cluster) %>% slice_max(n = 10, wt = avg_logFC)
Should be
top10 <- pbmc.markers %>% group_by(cluster) %>% slice_max(n = 10, order_by = avg_logFC)
There is no wt parameter in slice_max. Try this with n=200 or something like that and see what it gets you? It could be that the problem is cropping up elsewhere though.
And by "update" I meant feeding the output of that pipe-chain back into pbmc.markers. So it would have looked something like this (note the %<>% as the first pipe):
pbmc.markers %<>% group_by(cluster) %>% slice_max(n = 10, order_by = avg_logFC)
(But this doesn't matter. Just continue with what you have now.)
• 0 views
•
link
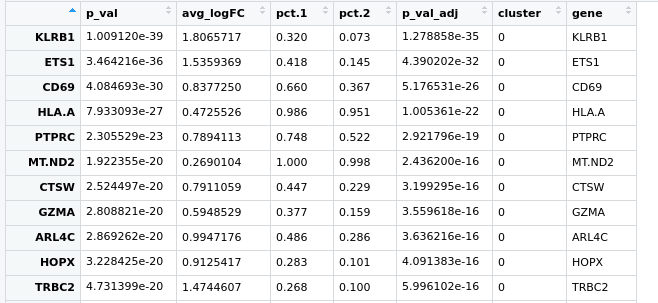
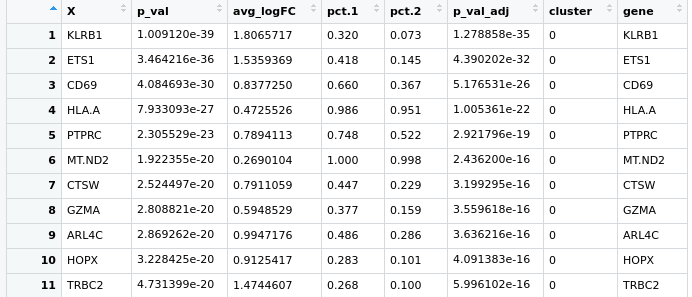
Hmm could you share the full code you're using to generate the plot? Does
pbmc.markers %>% group_by(cluster) %>% top_n(n = 10, wt = avg_logFC)feed directly into the plot, or is this supposed to updatepbmc.markersfirst? (Themagrittrpipe is uni-directional here, so it wouldn't updatepbmc.markerswith filtering criteria here.) As an aside, I would recommend replacingtop_n()withslice_max()orslice_min()as appropriate.