Entering edit mode

3.7 years ago
Chvatil
▴
130
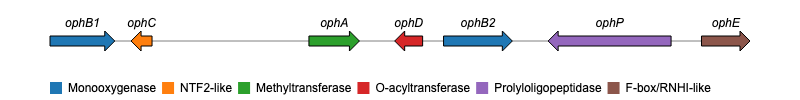
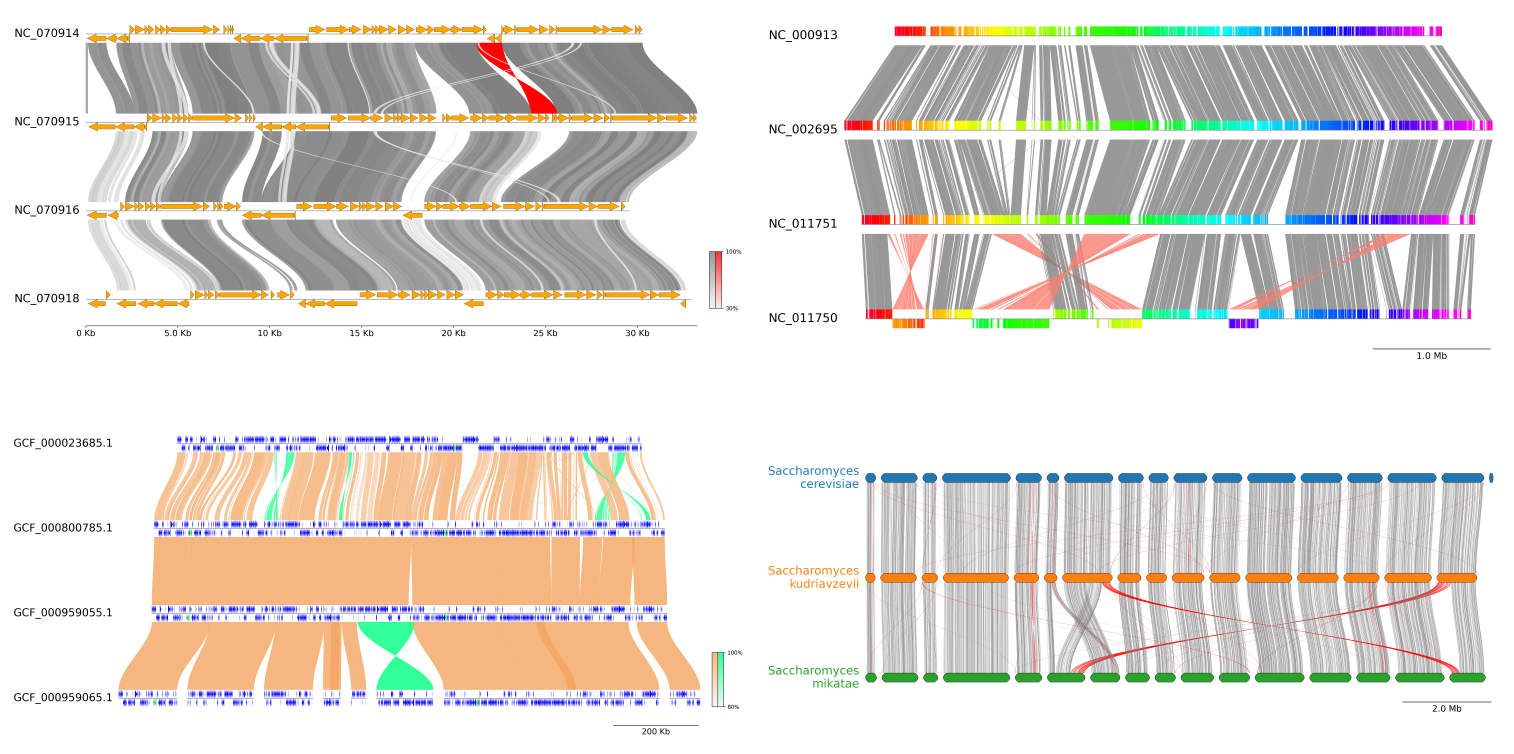
Hello everyone, i wrote this post to know if some of you knew a package on R (or something else) that could create a gene plot such this one :
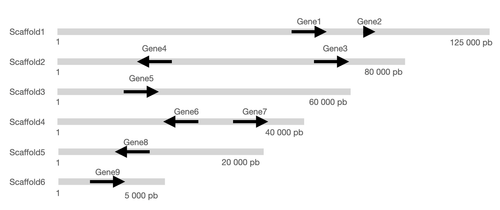
Indeed I wondered if it was possible to (1) add the information about the chr or scaffold length and (2) order the figure with the longest scaffold on the top and (3) add the start and stop coordinates of each scaffold?
It would be very useful since all scaffold have different length and this information on a plot can be really useful.
I already tried gggenes packages but it does not take the scaffold length into account.
Thank you very much for you time and thank you for the package.
Here are the data that could be used for such a plot:
   molecule  gene start_gene end_gene start_scaff end_scaff  strand direction
1 scaffold1 Gene1      64000    68000           1    125000 forward         1
2 scaffold1 Gene2      80000    83000           1    125000 forward         1
3 scaffold2 Gene3      60000    68000           1     80000 forward         1
4 scaffold2 Gene4      20000    28000           1     80000 reverse        -1
5 scaffold3 Gene5      22000    29000           1     60000 forward         1
6 scaffold4 Gene6      20000    33000           1     40000 reverse        -1
7 scaffold4 Gene7      35000    38000           1     40000 forward         1
8 scaffold5 Gene8      17000    19000           1     20000 reverse        -1
9 scaffold6 Gene9       2000     2500           1      5000 forward         1

dput(tab)

structure(list(molecule = structure(c(1L, 1L, 2L, 2L, 3L, 4L,
4L, 5L, 6L), .Label = c("scaffold1", "scaffold2", "scaffold3",
"scaffold4", "scaffold5", "scaffold6"), class = "factor"), gene = structure(1:9, .Label = c("Gene1",
"Gene2", "Gene3", "Gene4", "Gene5", "Gene6", "Gene7", "Gene8",
"Gene9"), class = "factor"), start_gene = c(64000L, 80000L, 60000L,
20000L, 22000L, 20000L, 35000L, 17000L, 2000L), end_gene = c(68000L,
83000L, 68000L, 28000L, 29000L, 33000L, 38000L, 19000L, 2500L
), start_scaff = c(1L, 1L, 1L, 1L, 1L, 1L, 1L, 1L, 1L), end_scaff = c(125000L,
125000L, 80000L, 80000L, 60000L, 40000L, 40000L, 20000L, 5000L
), strand = structure(c(1L, 1L, 1L, 2L, 1L, 2L, 1L, 2L, 1L), .Label = c("forward",
"reverse"), class = "factor"), direction = c(1L, 1L, 1L, -1L,
1L, -1L, 1L, -1L, 1L)), class = "data.frame", row.names = c(NA,
-9L))