Add metadata based on tree structure
2
4
Entering edit mode
4.5 years ago
Jack ▴ 50

Hello,

I just started working with ggtree to visualise phylogenetic trees and so far it works very well.

Now I would like to add some meta data (tab-, csv- or excel-file) based on tree structure.

Ideally it would look similiar to this example:

https://yulab-smu.github.io/treedata-book/chapter7.html#facet_plot enter image description here

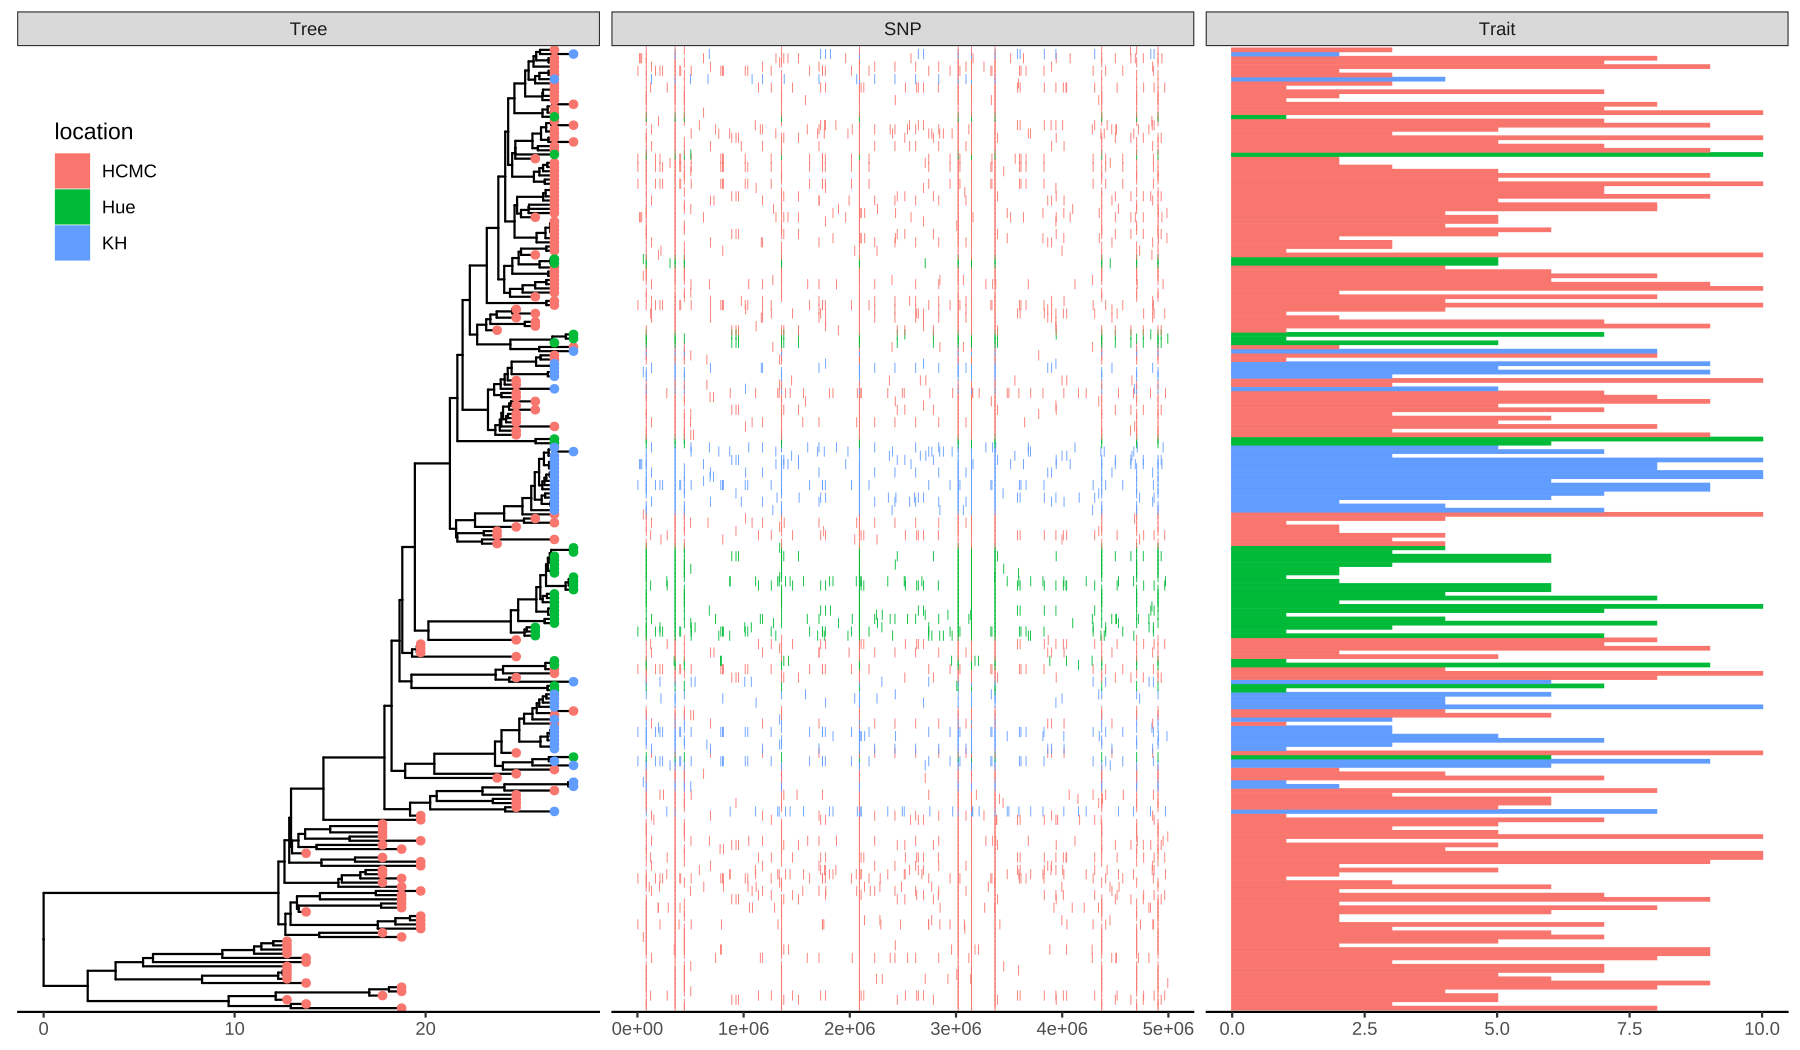
But instead of the SNP and Trait data, I would like to use simple text (tab-, csv- or excel-file).

[Tree//header] [metadata1//header] [metadata2//header] [...//header]

ID1 MetadataForID1 moreMetadataForID1 ...

Is there maybe a simple way to add this kind of data?

Thank you!

R ggtree • 5.0k views
ADD COMMENT
1
Entering edit mode

Thank you for your answers!

With the help of the following code I am able to add meta data, that is saved in a .txt-file ('d1'):

ggtree(tree) %<+% d1 + geom_tiplab() + geom_tiplab(aes(label = factor(sample)), offset=0.1) + theme_tree2() + geom_tiplab(aes(label = factor(metadata)), offset=0.4) + xlim(NA, 4)

enter image description here

After aligning the data, I can not remove the lines:

ggtree(tree) %<+% d1 + geom_tiplab(align=TRUE, linesize=.5) + geom_tiplab(aes(label = factor(sample)), offset=0.1, align=TRUE) + theme_tree2() + geom_tiplab(aes(label = factor(metadata)), offset=0.4, align=TRUE) + xlim(NA, 4)

enter image description here

Is there a way to remove the lines for 'sample' and 'metadata'? And is it possible to add a header with a grey background, just like the one in my first post, for 'Sample' and 'metadata'?

ADD REPLY
4
Entering edit mode
4.5 years ago
Guangchuang Yu ★ 2.6k

The first column should be node numbers or labels for ggtree to link your data to the tree.

Please refer to our paper, https://academic.oup.com/mbe/article/35/12/3041/5142656. There are a number of examples in the supplemental file.

ADD COMMENT
2
Entering edit mode
4.5 years ago
thackl ★ 3.0k

If you are interested in some flexibility beyond ggtree's nice built-in functions, check out my blog post about an alternative approach: https://thackl.github.io/ggtree-composite-plots

ADD COMMENT
0
Entering edit mode

Thanks for the links!

But unfortunately I could not find any example with plain text.

All the examples use only geom_tiplab() for text and add data to that. So for example SNP or trait data, matrix, sequence alignment, plot, ... I could not find any example with two or three columns of text

So, all I have is a text file, that looks like this:

label sample metadata

t1 Sample_1 metadata_1

t2 Sample_2 metadata_2

t3 Sample_3 metadata_3

t4 Sample_4 metadata_4

t5 Sample_5 metadata_5

No data and no x values.

So right now I have no clue how to realise this.

Thats why I painted a picture of the output, that I would like to achieve: enter image description here

Has anyone an idea, how to implement this?

ADD REPLY

Login before adding your answer.

Traffic: 1319 users visited in the last hour
Help About
FAQ
Access RSS
API
Stats

Use of this site constitutes acceptance of our User Agreement and Privacy Policy.

Powered by the version 2.3.6