I know this is an old post, but it seems to me that the question is still relevant.
I have achieved some table like structure using the geom_tiplab function, but there must be a much better and easier way to do this. Does anyone have a suggestion how?
Here's my code and the result:
library(ggtree)
library(tidyverse)

## Create a random tree
tree <- rtree(20)

## And some random metadata
df <- tibble(
  tip_name = tree$tip.label,
  long_and_disturbing_colname = paste(tree$tip.label, 'meta1', sep="_"),
  other_colname = paste(tree$tip.label, 'long_long_meta2', sep="_"),
  other_colname2 = paste(tree$tip.label, 'meta3', sep="_")
)

## Add table data
tab_cols <- c(
  "Meta1" = "long_and_disturbing_colname",
  "Meta2" = "other_colname",
  "Meta3" = "other_colname2"
)

table_tib <- tibble(
  name=tab_cols,
  ring_label=names(tab_cols),
  rel_width=c(1, 2, 1)
)

## And and also gather some plotting parameters for this in a vector
tabv <- data.frame(
  offs_s = 1,
  ann_yjust = 1.0, ann_xjust = 0.000,
  ann_vjust = 0.5, ann_hjust = 0,
  ann_size = 3,
  xdiff = 1,
  size = 2.5
)

## add some info to dataframe from above
table_tib$width <- as.numeric(table_tib$rel_width)*tabv$xdiff
table_tib$x_start <- cumsum(c(0, table_tib$width[1:(nrow(table_tib)-1)]))

## Plot the tree
p <- ggtree(tree, layout="rectangular") %<+% df
q <- p + geom_tiplab(aes(label= label), size=2.6,linesize=0.02, linetype="dashed", geom="text",
              align=F, offset = 0.1) # Tip labels
## add tip labels are added for each column
for(i in 1:nrow(table_tib)) {
  table_row = table_tib %>% slice(i)
  q <- q + geom_tiplab(aes(subset=isTip, label=.data[[table_row %>% pull("name")]]), size=tabv$size, geom="text", align=T, linesize=0.05, linetype=NA, show.legend = F, offset=tabv$offs_s + table_row %>% pull("x_start")) +
    annotate(geom="text", x=max(p$data$x) + tabv$offs_s + table_row %>% pull("x_start") + tabv$ann_xjust, y = max(p$data$y) + tabv$ann_yjust,
             label=table_row %>% pull("ring_label"), size=tabv$ann_size, angle=0, vjust=tabv$ann_vjust, hjust=tabv$ann_hjust)
}
## Plot with xlim to avoid cutting the last column
q + xlim(NA,10)
And here is the result:

So the desired features are:
- pure text in form of table linked by (sorted by) the tip labels matching the first column of the tibble
- adjustable text size, offset etc. parameters
- (custom) column titles
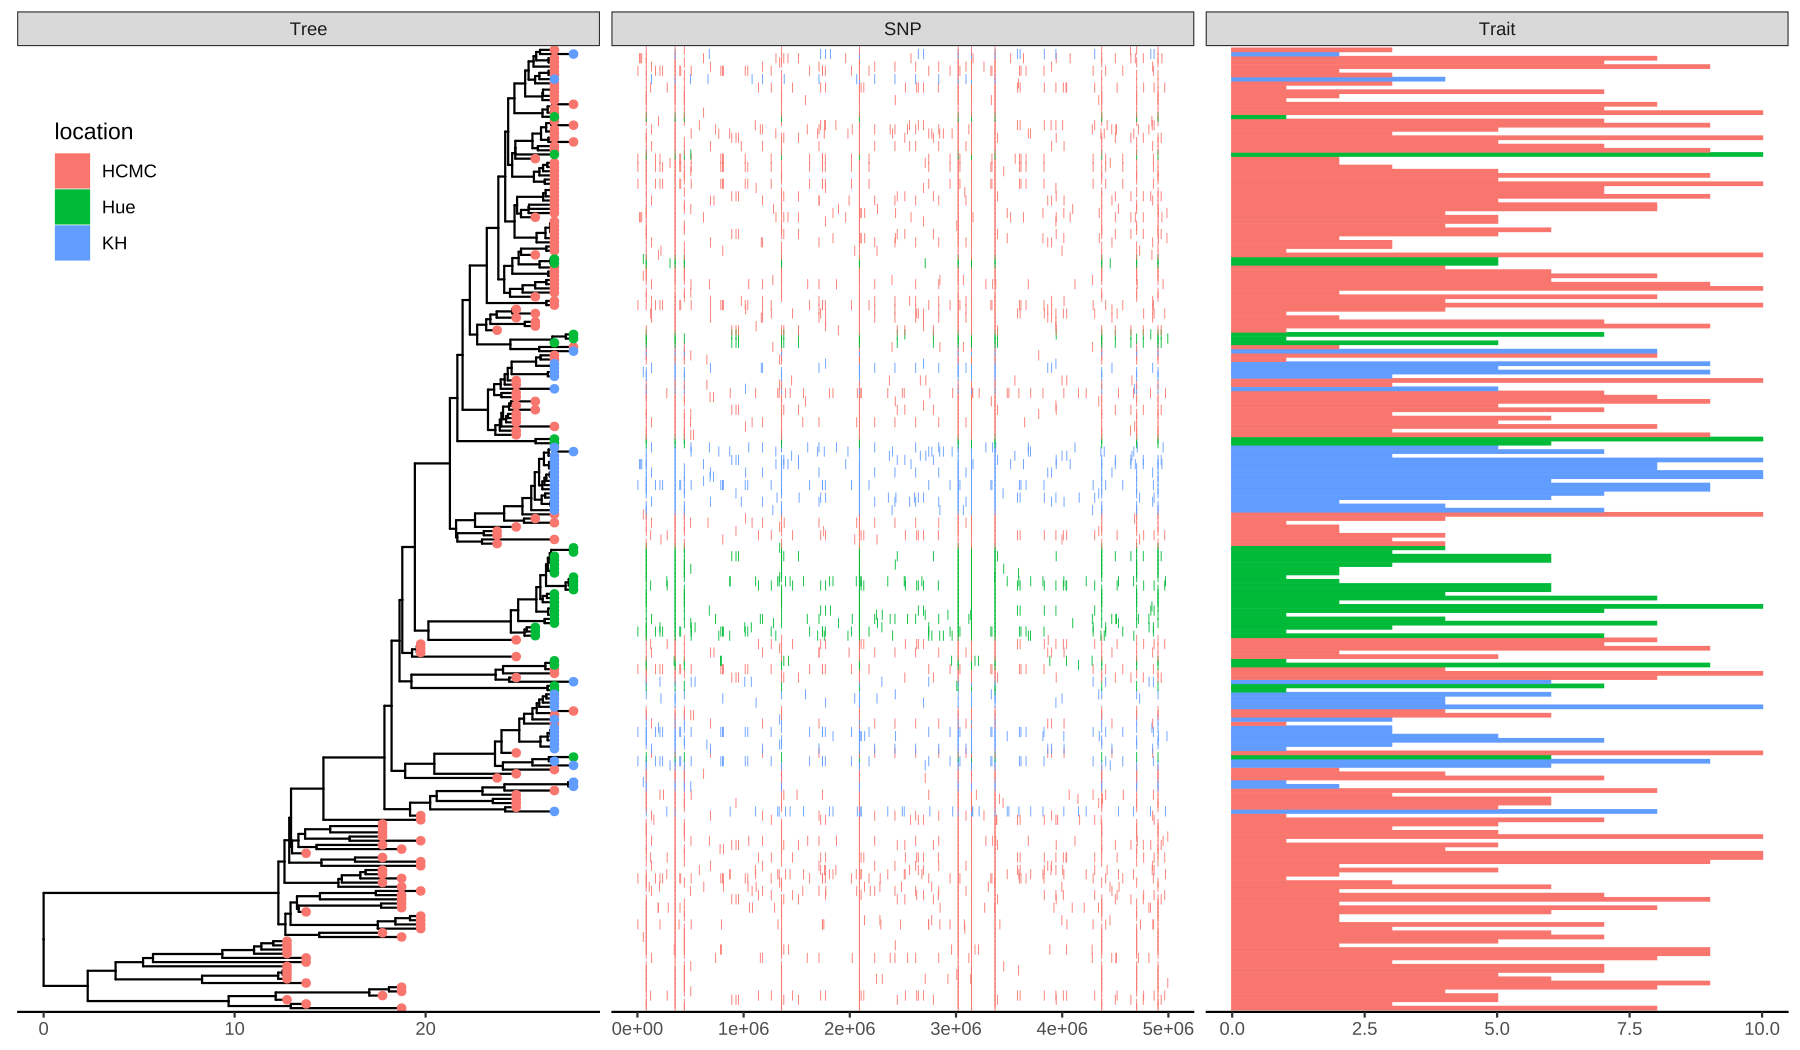

Thank you for your answers!
With the help of the following code I am able to add meta data, that is saved in a .txt-file ('d1'):
After aligning the data, I can not remove the lines:
Is there a way to remove the lines for 'sample' and 'metadata'? And is it possible to add a header with a grey background, just like the one in my first post, for 'Sample' and 'metadata'?