I'm preparing a presentation on an algorithm for processing RNA-seq data. The audience will have a varied background, but I don't want to assume more than basic experience with biology and DNA sequencing. I'm having a hard time finding graphics to supplement this presentation. Any pointers? Here is what I'm looking for.
- A graphic describing how ESTs are sequenced in an RNA-seq experiment (I understand this is very specific, so a good graphic describing the sequencing process in general might work here)
- A graphic showing ESTs mapped back to a reference genome.
Thanks.
Update: Thanks for the responses, although we didn't end up including any of the suggested pictures. This was a really hard presentation to find pictures for. I make it a point to reduce text and increase visuals in my presentations, so this one didn't turn out as well as I had hoped. Anyway, you can find it here. Let me know your thoughts.
2 answers

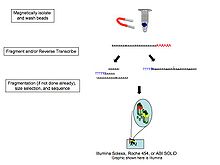

Check out this paper, and see if Figure 2C suits one your needs. I think it's effective, but I sorta am not your target for this probably.
EDIT: here's another one I found helpful getting started in this area. See Figure 1: Mapping and quantifying mammalian transcriptomes by RNA-Seq
Log in to answer this question.
Could you please post the presentation back to this forum when it is done? It would be nice to have more resources like this available.
Sure. I'm not going to promise much, but I'll share what we come up with!