How to generate a stripplot like this in Python or R?
How to generate a stripplot like this in Python or R?
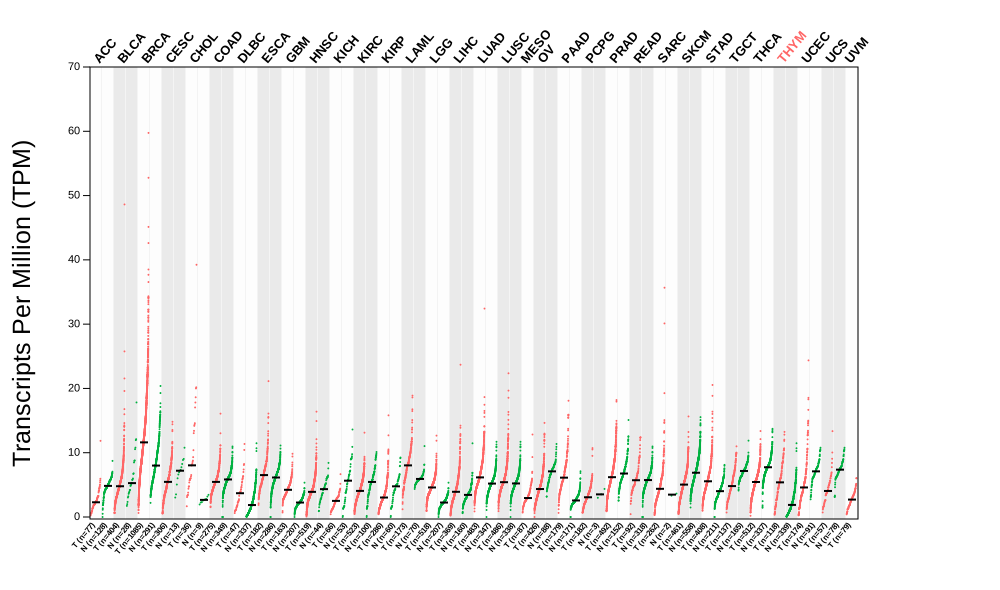
Thank you so much in advance.
• 3,067 views
•
link
1 answer
some thing like this ?

codeL
library(dplyr)
library(tidyr)
df=data.frame(s1=rnorm(1000,0,10), s2=rnorm(1000,1,10), s3=rnorm(1000,2,10))
library(ggplot2)
df1=gather(df,"sample","value")

ggplot(df1, aes(x = sample, y = value)) +
  geom_point(aes(color=sample)) +
  stat_summary(
    fun.y = median,
    fun.ymin = median,
    fun.ymax = median,
    geom = "crossbar",
    color = "red",
    width=0.2,
    linetype = "dotted"
  )+
  ylim(-100,100)+
  theme_bw()+
  theme(legend.position="none")
• 0 views
•
link
Log in to answer this question.
in R you can just make a scatter plot in something like ggplot2. You could use facets per gene.
Another example is here. I don't think the author used facet to draw this. It seems that it used a special version of jitter (ordered).
usually, jitter in boxplot only generates some noise in x-axis to avoid overlapping. I don't know how to do it in an ordered manner. Can you show some code snippet? Thank you.
Related post: Plots in R for bioinformatics analyses