How to make barplot with points in ggplot2
Dear all, how to make barplot with points in ggplot2? I know that graphpad can do this, but I wonder if there are ways in R. The point should be dispersive, not devided by bins. Just like the picture below. Thank you very much!
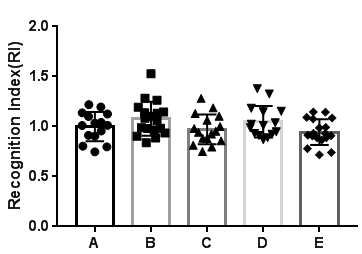
• 1,843 views
•
link
0 answers
No answers yet.
Log in to answer this question.
Hello afli!
We believe that this post does not fit the main topic of this site.
Unrelated to bioinformatics. Please search StackExchange or similar sites.
For this reason we have closed your question. This allows us to keep the site focused on the topics that the community can help with.
If you disagree please tell us why in a reply below, we'll be happy to talk about it.
Cheers!
Sorry, I'll search StackExchange or similar sites for my question. Thank you for your suggestion.