This is a test version of Biostars. For the public version, visit https://www.biostars.org.
Downstream proportions are not identical in vennpie and upsetplot results

Hi,

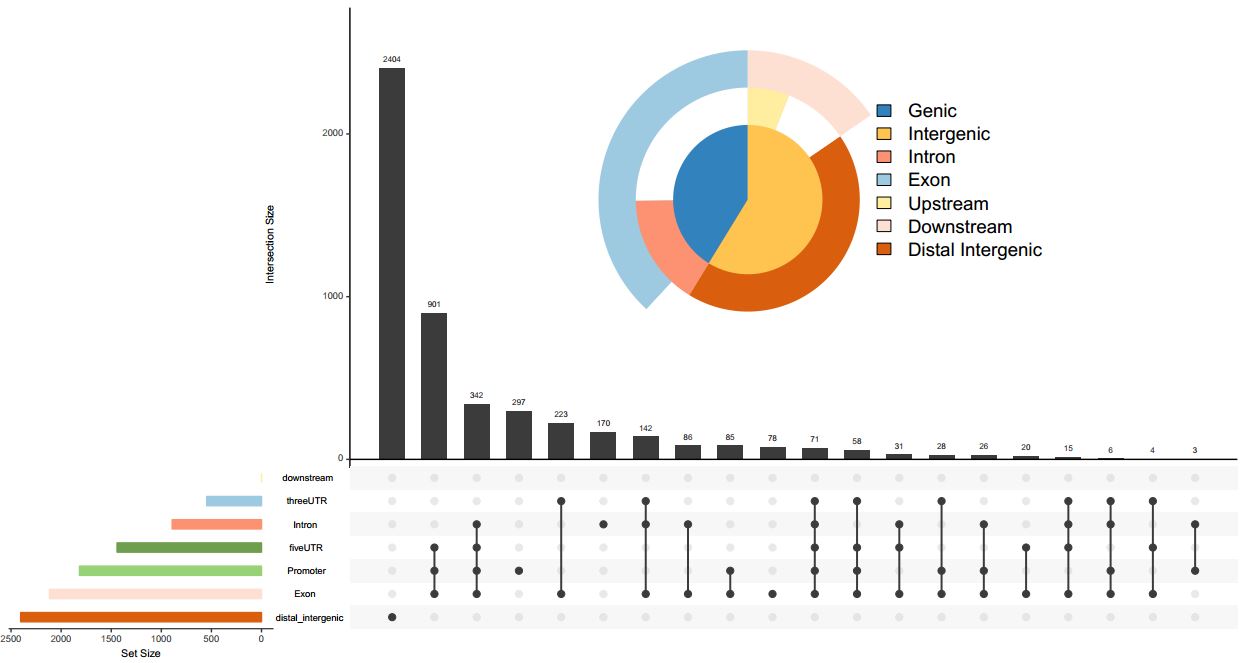
I find that the peaks in downstream region is zero in upsetplot, but it take up some part in ven plot. Where is this difference come from?

enter image description here

Thank you!

chipseeker upsetplot r

Yes, I used the example in your tutorial, and the same issue occur. My command lines are as follows:

library(ChIPseeker)

files <- getSampleFiles()
peak <- readPeakFile(files[[4]])

require(TxDb.Hsapiens.UCSC.hg19.knownGene)

txdb <- TxDb.Hsapiens.UCSC.hg19.knownGene
peakAnno <- annotatePeak(files[[4]], tssRegion=c(-3000, 3000),TxDb=txdb)

pdf("upsetplot_test.pdf",width =13, height=7)
upsetplot(peakAnno, vennpie=TRUE)
dev.off()

In the pdf file, downstream region is always False, and be zero.My session information is as follows:

sessionInfo()

R version 3.5.0 (2018-04-23)
Platform: x86_64-pc-linux-gnu (64-bit)
Running under: Ubuntu 14.04.5 LTS
Matrix products: default
BLAS: /mnt/tiger/afli/softwares/R3.5.0_afli/lib/R/lib/libRblas.so
LAPACK: /mnt/tiger/afli/softwares/R3.5.0_afli/lib/R/lib/libRlapack.so

locale:

 [1] LC_CTYPE=en_US.UTF-8       LC_NUMERIC=C              
 [3] LC_TIME=en_US.UTF-8        LC_COLLATE=en_US.UTF-8    
 [5] LC_MONETARY=en_US.UTF-8    LC_MESSAGES=en_US.UTF-8   
 [7] LC_PAPER=en_US.UTF-8       LC_NAME=C                 
 [9] LC_ADDRESS=C               LC_TELEPHONE=C            
[11] LC_MEASUREMENT=en_US.UTF-8 LC_IDENTIFICATION=C

attached base packages:
[1] stats4    parallel  stats     graphics  grDevices utils     datasets 
[8] methods   base     

other attached packages:
 [1] TxDb.Hsapiens.UCSC.hg19.knownGene_3.2.2
 [2] GenomicFeatures_1.32.0                 
 [3] AnnotationDbi_1.42.1                   
 [4] Biobase_2.40.0                         
 [5] GenomicRanges_1.32.3                   
 [6] GenomeInfoDb_1.16.0                    
 [7] IRanges_2.14.10                        
 [8] S4Vectors_0.18.3                       
 [9] BiocGenerics_0.26.0                    
[10] ChIPseeker_1.16.0

loaded via a namespace (and not attached):
 [1] bitops_1.0-6                matrixStats_0.53.1         
 [3] enrichplot_1.0.2            bit64_0.9-7                
 [5] RColorBrewer_1.1-2          progress_1.2.0             
 [7] httr_1.3.1                  UpSetR_1.3.3               
 [9] tools_3.5.0                 R6_2.2.2                   
[11] KernSmooth_2.23-15          DBI_1.0.0                  
[13] lazyeval_0.2.1              colorspace_1.3-2           
[15] tidyselect_0.2.4            gridExtra_2.3              
[17] prettyunits_1.0.2           bit_1.1-14                 
[19] compiler_3.5.0              DelayedArray_0.6.1         
[21] labeling_0.3                rtracklayer_1.40.3         
[23] caTools_1.17.1              scales_0.5.0               
[25] ggridges_0.5.0              stringr_1.3.1              
[27] digest_0.6.15               Rsamtools_1.32.0           
[29] DOSE_3.6.1                  XVector_0.20.0             
[31] pkgconfig_2.0.1             plotrix_3.7-2              
[33] rlang_0.2.1                 RSQLite_2.1.1              
[35] bindr_0.1.1                 gtools_3.8.1               
[37] BiocParallel_1.14.1         GOSemSim_2.6.0             
[39] dplyr_0.7.6                 RCurl_1.95-4.10            
[41] magrittr_1.5                GO.db_3.6.0                
[43] GenomeInfoDbData_1.1.0      Matrix_1.2-14
[45] Rcpp_0.12.17                munsell_0.5.0              
[47] viridis_0.5.1               stringi_1.2.3              
[49] ggraph_1.0.2                MASS_7.3-50                
[51] SummarizedExperiment_1.10.1 zlibbioc_1.26.0            
[53] gplots_3.0.1                plyr_1.8.4                 
[55] qvalue_2.12.0               grid_3.5.0                 
[57] blob_1.1.1                  gdata_2.18.0               
[59] ggrepel_0.8.0               DO.db_2.9                  
[61] crayon_1.3.4                lattice_0.20-35            
[63] Biostrings_2.48.0           cowplot_0.9.2              
[65] splines_3.5.0               hms_0.4.2                  
[67] pillar_1.2.3                fgsea_1.6.0                
[69] igraph_1.2.1                boot_1.3-20                
[71] reshape2_1.4.3              biomaRt_2.36.1             
[73] fastmatch_1.1-0             XML_3.98-1.11              
[75] glue_1.2.0                  data.table_1.11.4          
[77] tweenr_0.1.5                gtable_0.2.0               
[79] purrr_0.2.5                 assertthat_0.2.0           
[81] ggplot2_3.0.0               gridBase_0.4-7             
[83] ggforce_0.1.3               viridisLite_0.3.0          
[85] tibble_1.4.2                GenomicAlignments_1.16.0   
[87] memoise_1.1.0               units_0.6-0                
[89] bindrcpp_0.2.2

This is my upsetplot pdf file:

2 answers

thanks for reporting this issue. It has been fixed in v=1.16.1.

I haven't thought carefully about your question but the first explanation that comes to my mind is that proportional Venn diagrams with 3 or more sets are not always possible. See this post Venn/Euler Diagram Of Four Or More Sets.

Thanks my friend, I see the post and UpSetR is recommended in the reply, I do not quite understand it why proportional Venn diagrams with 3 or more sets are not always possible, because UpSetR can easily handle six sets. Maybe I should think your advice further.

Log in to answer this question.