Analysis of DNA Methylation data from TCGA
1
1
Entering edit mode
5.3 years ago
adriankoh002 ▴ 10

Hi all,

I am new to bioinformatics and am working on a school ML project that seeks to use the DNA Methylation data extracted from TCGA, to identify cancerous tissues from normal/control tissues, as well as distinguish between the different types of cancer (i.e. BRCA v.s COAD).

I have downloaded the "Illumina Human Methylation 450" level 3 data-set and will like to know how can I tell if a sample is cancerous, or normal/healthy since it is not indicated and I will require the information, in order to create a training data set.

The headers included in the data-sets which I have downloaded are as follows:

1) Composite Element REF 2) Beta_Value 3) Chromosome 4) Start 5) End 6) Gene Symbol 7) Gene Type 8) Transcript ID 9) Position to TSS 10) CGI Coordinate 11) Feature Type

This seems to be quite different from the headers present for another similar study (https://arxiv.org/ftp/arxiv/papers/1804/1804.04839.pdf) as they have a header which states the class of the tumor (normal or cancerous).

Thus, can I check if the "class" header is present on level 2 or level 1 data instead? Or is it distinguished via the assigned TCGA barcode number:

enter image description here

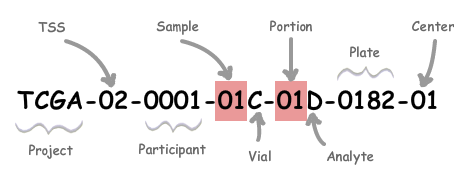
Moreover, I am currently analyzing the .txt data via excel, thus are there any other methods available instead? Any help will be greatly appreciated as I am currently quite lost, and worried about the lack of progress.

Thanks,

Ad.

TCGA DNA Methylation • 3.2k views
ADD COMMENT
2
Entering edit mode
5.3 years ago

Hey,

Your file names should look something like this: jhu-usc.edu_UCEC.HumanMethylation27.3.lvl-3.TCGA-BK-A0CB-11A-33D-A10Q-05.gdc_hg38.txt. The part, TCGA-BK-A0CB-11A-33D-A10Q-05, is the full TCGA barcode and we can tell that this is a normal sample by the presence of the 11A. Conversely, this, jhu-usc.edu_UCEC.HumanMethylation450.12.lvl-3.TCGA-AX-A2HF-01A-11D-A17F-05.gdc_hg38.txt, is a tumour sample, due to 01A.

The encoding goes like this:

  • tumor types range from 01 - 09
  • normal types from 10 - 19
  • control samples from 20 - 29

It is thus possible to obtain a file listing of all files in R and the determine the tissue type by using a regular expression (regex) to pattern match on the TCGA barcode.

Once you identify tumour and normal samples, a possible analysis to perform is Wilcoxon Signed Rank test that compares the Beta (β) values in tumour versus normal, and derives a p-value for each gene. The difference in mean β (i.e. mean(tumour) - mean(normal)) should also be obtained.

It is generally not a good idea to perform analyses in Excel®.

Kevin

ADD COMMENT

Login before adding your answer.

Traffic: 2969 users visited in the last hour
Help About
FAQ
Access RSS
API
Stats

Use of this site constitutes acceptance of our User Agreement and Privacy Policy.

Powered by the version 2.3.6