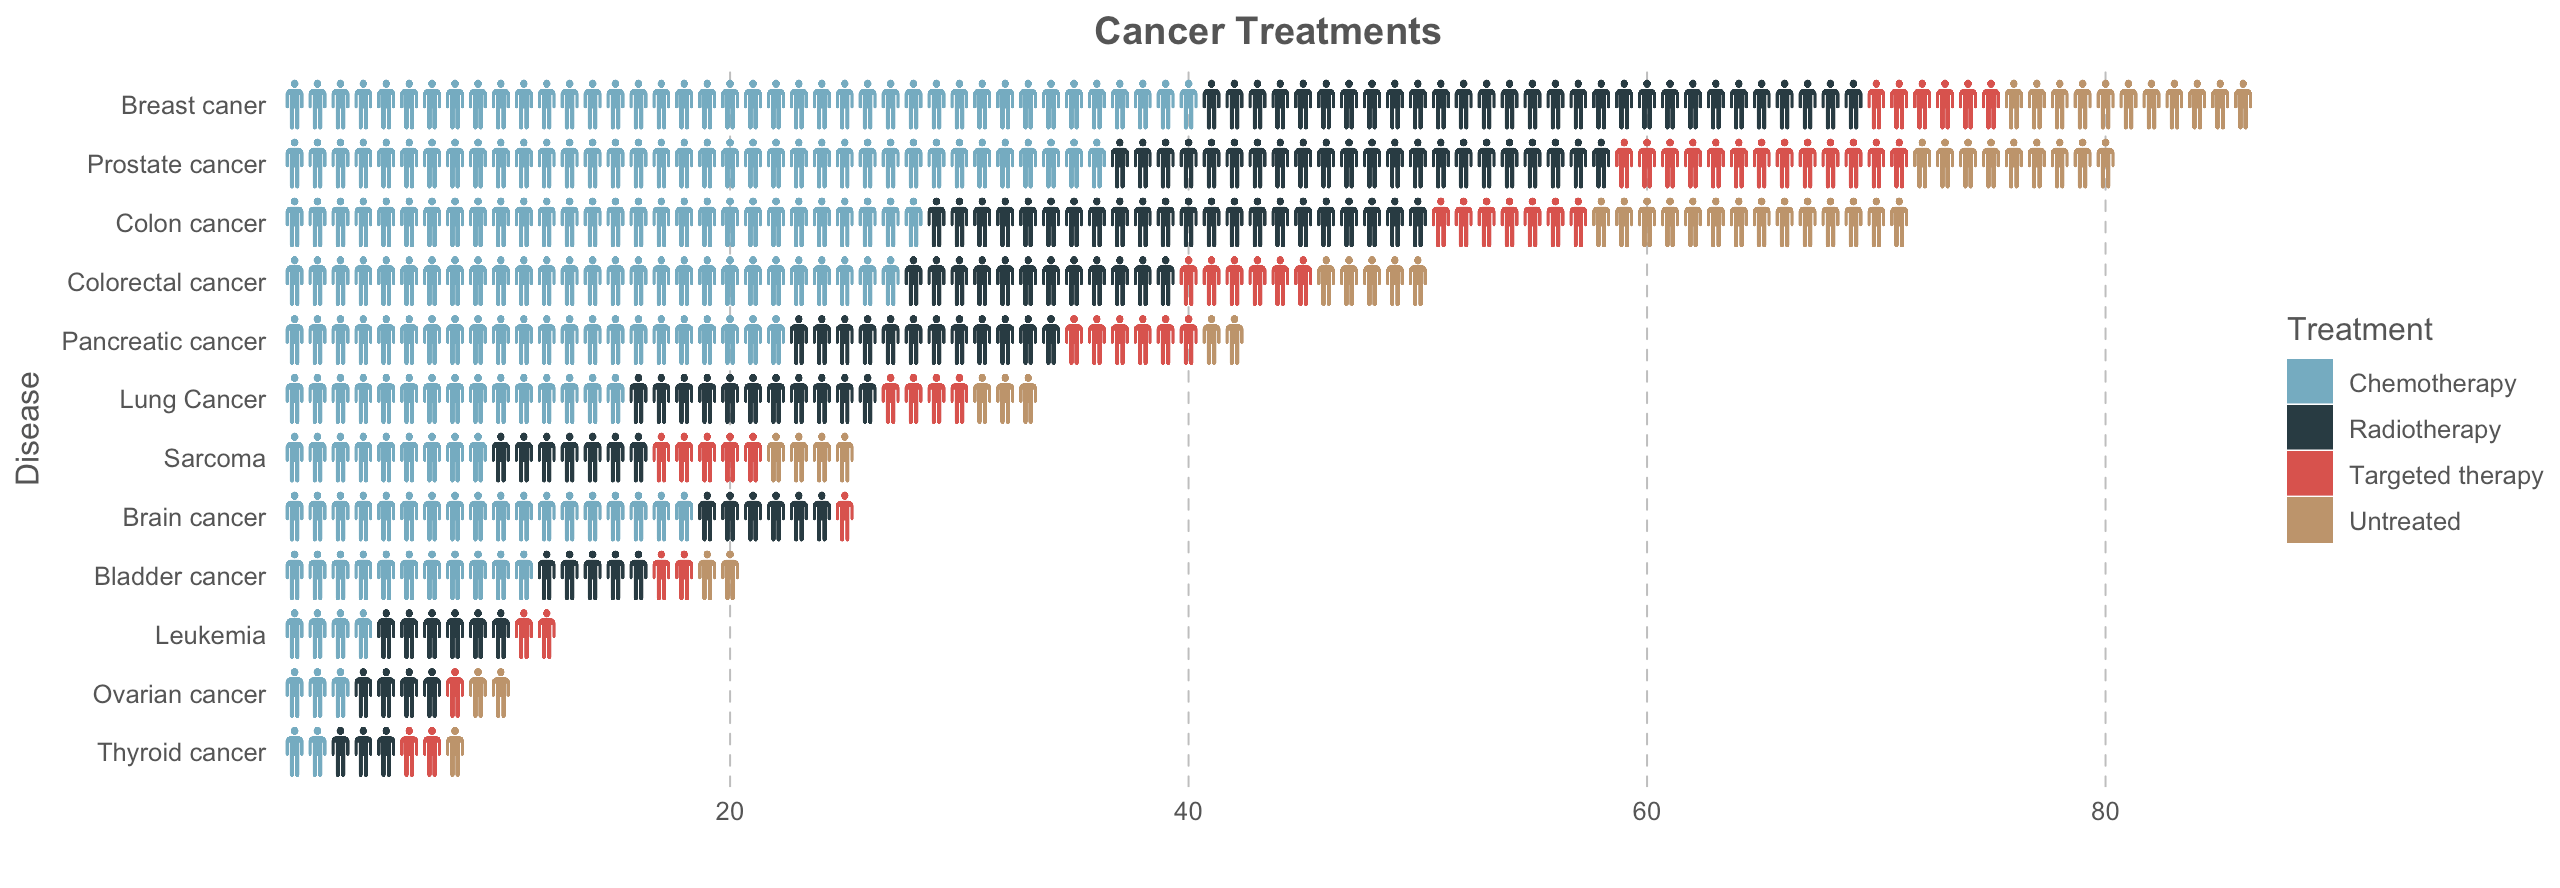
At a recent conference, a colleague of mine presented a summary plot of her patient cohort in the form of stacked people icons, and it was wildly popular among the audience. Many asked how they can make such plot, but unfortunately it was made manually using powerpoint. Therefore we figured out a R solution to programmatically make this type of colored stack bar with any image icons on the internet:
Some examples:
https://upload.wikimedia.org/wikipedia/commons/d/d8/Person_icon_BLACK-01.svg
 https://svgsilh.com/svg/295375.svg
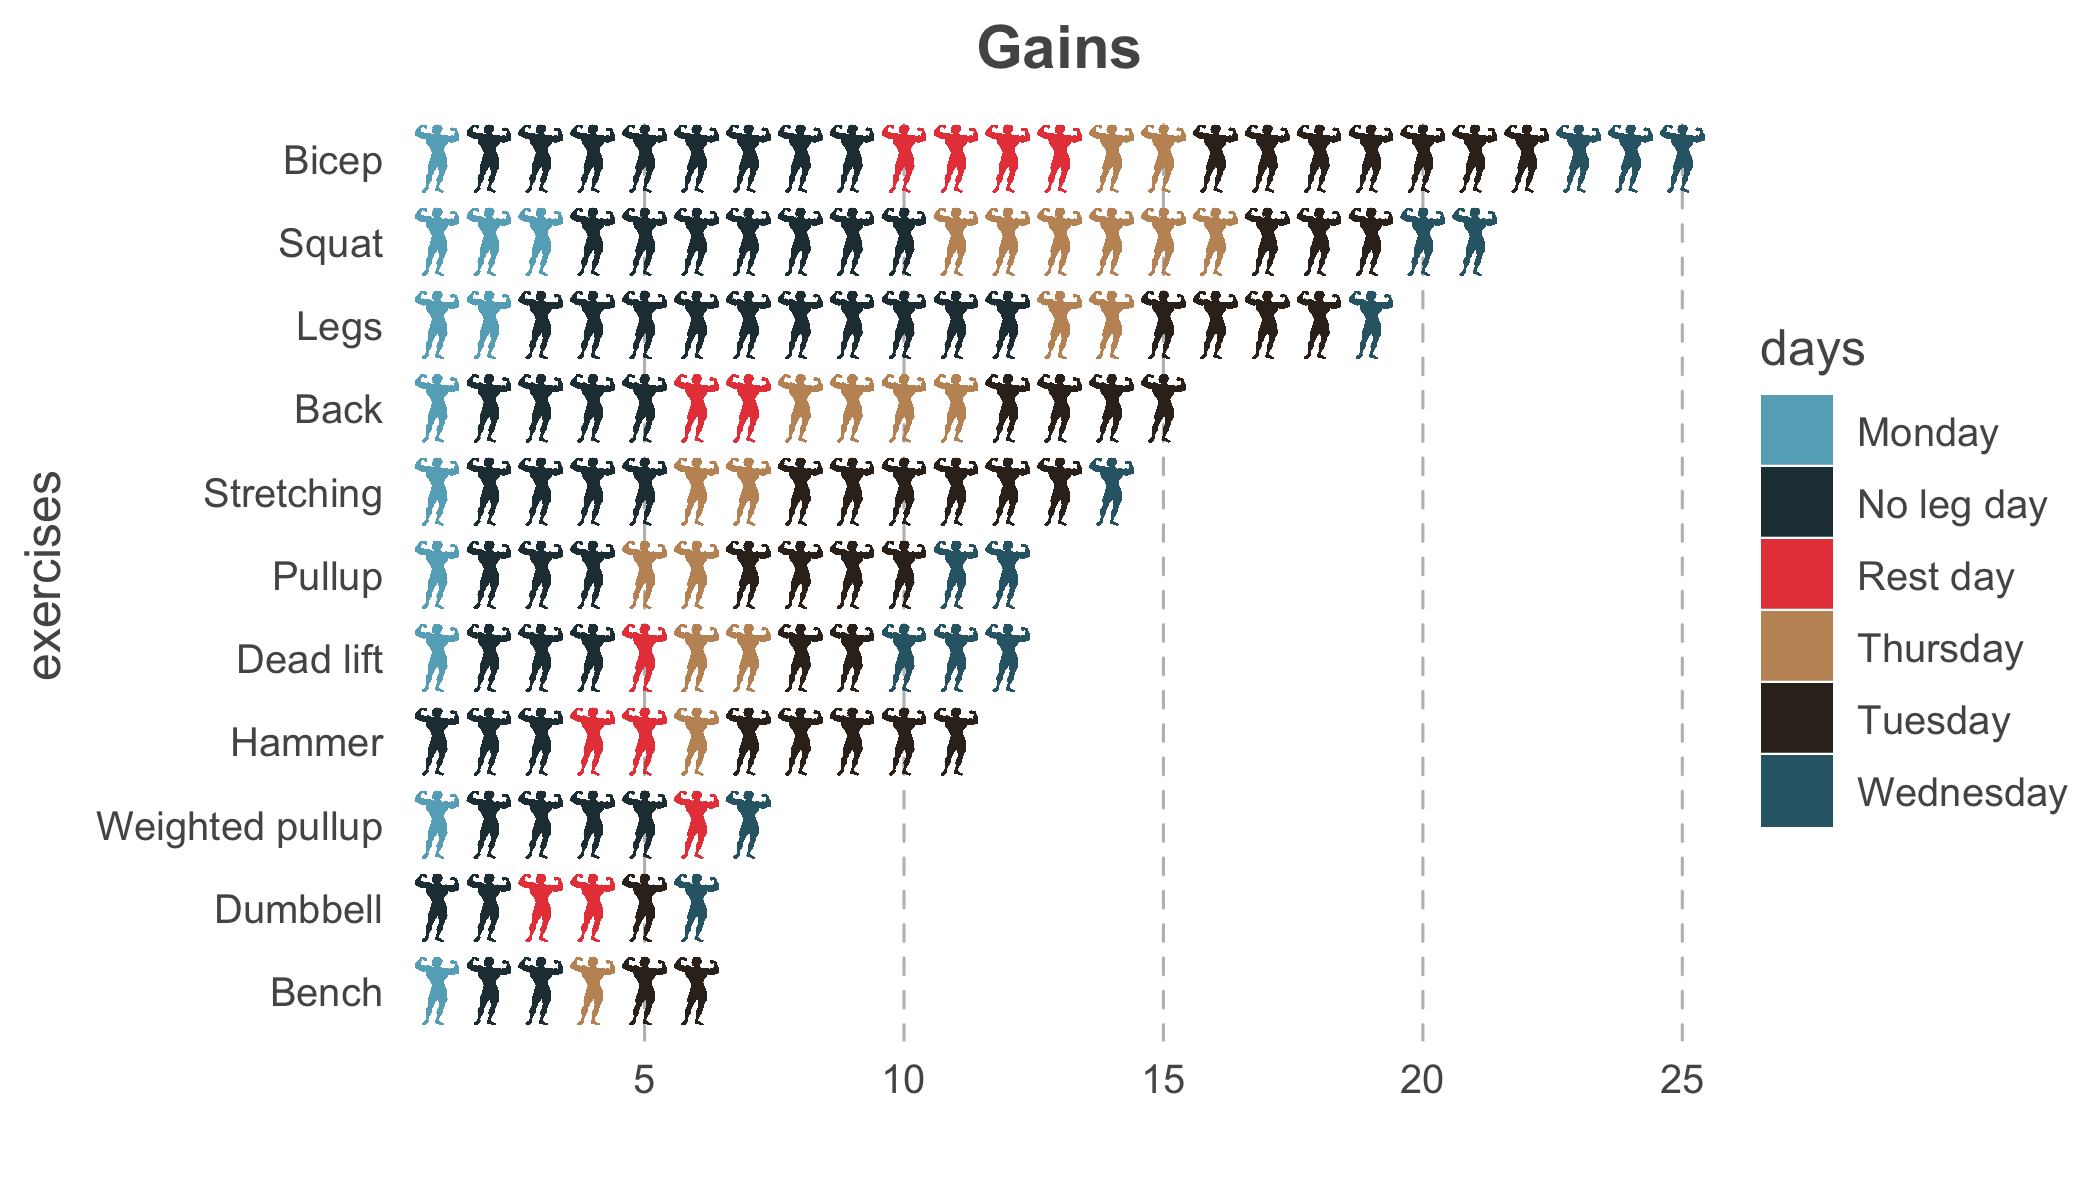


The function builds upon ggimage and is almost an automatic solution, with one remaining problem that one has to manually adjust the aspect ratio and icon size for the plot to look nice. Any suggestions on how to automate this step would be greatly appreciated.
Let us know what you stack!
0 answers
No answers yet.
Log in to answer this question.
+1 for using gains as an example!