• 0 views
•
link
How to make k-means clustering plot for relative expression?
Hi
I have a question about how to make cluster for relative expression (on read counts) using k-means clustering, I couldn't find any good manual for solving this problem.
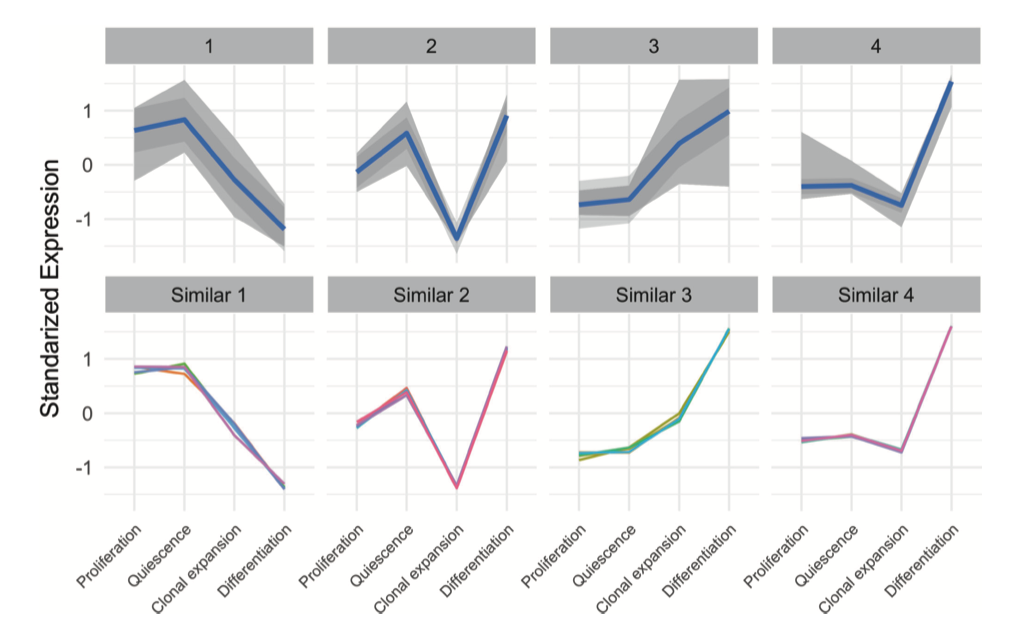
I need to make a plot like below: to have different cluster on genes count:
Does anybody know how to make it?
• 16,866 views
•
link
2 answers
I have solved the problem, the code should be something like below:
You need to run DESeq2 before processing rowMeans:
library(ggplot2)
library(DESeq2)
#suppose you have one column per each time/tissue condition

cds <- DESeq(cds)
vst <- getVarianceStabilizedData(cds)
df <- vst
df <- df - rowMeans(df)
df <- as.data.frame(df)
colnames(df)
res_km <- kmeans(df, 5, nstart = 10)
data_plot <- data.table(melt(data.table(class = as.factor(res_km$cluster), df)))
data_plot[, Time := rep(1:ncol(df), each = nrow(df))]
data_plot[, ID := rep(1:nrow(df), ncol(df))]
head(data_plot)
# prepare centroids
centers <- data.table(melt(res_km$centers))
setnames(centers, c("Var1", "Var2"), c("class", "Time"))
centers[, ID := class]
centers[, gr := as.numeric(as.factor(Time))]
head(centers)
head(data_plot)
# plot the results
ggplot(data_plot, aes(variable, value, group = ID)) +
  facet_wrap(~class, ncol = 2, scales = "free_y") +
  geom_line(color = "grey10", alpha = 0.65) +

  geom_line(data = centers, aes(gr, value),
            color = "firebrick1", alpha = 0.80, size = 1.2) +
  labs(x = "Time", y = "Load (normalised)") +
  theme_bw()
• 1 views
•
link
Thank you for your code~ I get Figure like this. https://ibb.co/wrZvYbh
• 0 views
•
link
~~ your welcome !!!!
• 0 views
•
link
Hi Ahmad, Thanks for your code. I', relatively new to this. Can you please share a code for highlighting selected genes and their trend in the K-means cluster ! attached the example image link
Thanks a lot
• 0 views
•
link
Hi, here is the solution using dplyr. In the script below, you need to set the path of tab delim .txt file at file_path variable. In the given files, columns should be variables and rows should be observations (E.g. genes). Each column and row must have unique identity given as first row and first column respectively.
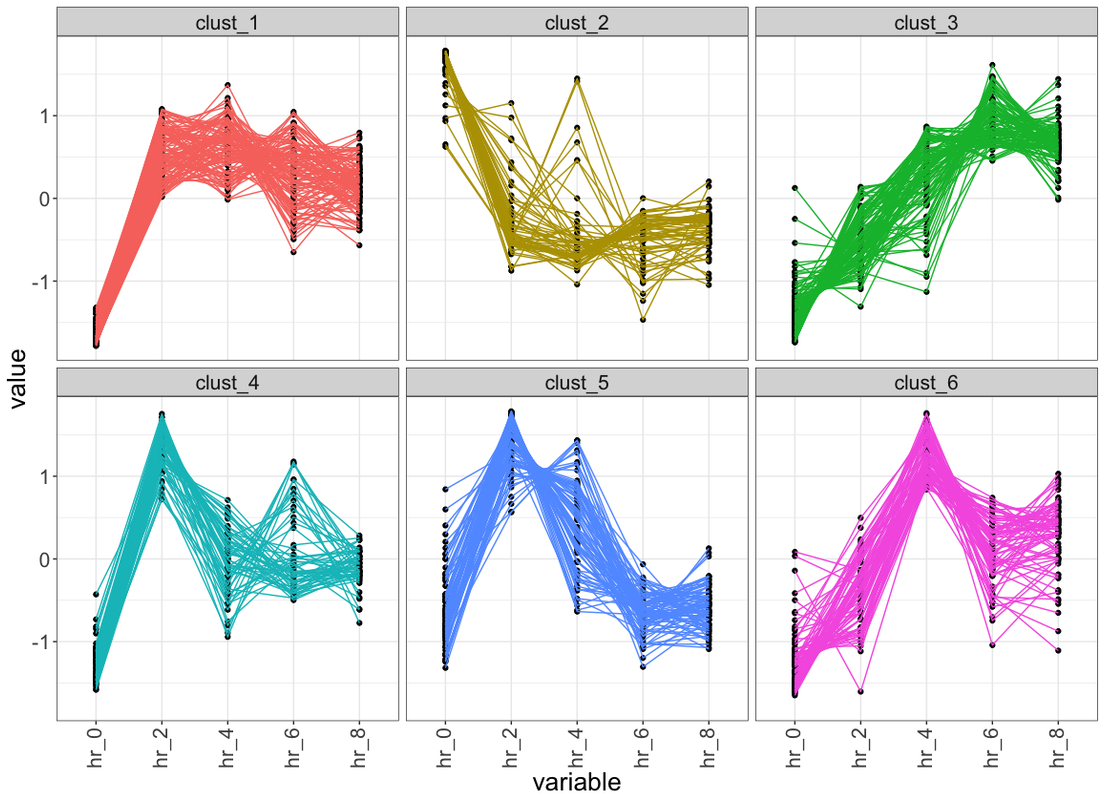
Below is the sample plot generated from one of my time series data.
    library(tidyverse)
    file_path  = "path_to_tab_delim_file"  ## file must have colnames, where first column is geneName and all other columns are relative expression in given sample
    data <- read_delim(file_path ,delim = "\t") %>%
rename_if(is.numeric ,  ~(paste("hr", seq(0,8,by = 2),sep = "_"))) ## rename column names if require otherwise you can comment this line

    ## prepare data for cluster
    for_clust  <- data %>%
      select(-1) ## remove first column which is gene id

    ### kmeans
    max_itr <-  50
    n_clust  <-  6  ## number of cluster
    set.seed(123) ## reproduce the cluster
    kmeans_out  <- kmeans(for_clust,n_clust,iter.max = max_itr)

    ## add cluster info to orig matrix
    data_with_cust_info <- data %>%
      mutate(clust = paste("clust_", kmeans_out$cluster,sep = ""))


    ## visualise  each cluster
    data_with_cust_info %>%
      gather(key = "variable" , value = "value", -c(1,7)) %>%  ### 1 is the index of column 'geneName' and 7 is the index of column 'clust'
      group_by(variable) %>%
      mutate(row_num =  1:n()) %>%
      ggplot(aes(x =  variable , y = value , group = row_num)) +
      geom_point() +
      geom_line(alpha = 1 , aes(col = as.character(clust))) +
      theme_bw() +
      theme(legend.position = "none" , axis.text.x = element_text(angle = 90 , vjust = 0.4)) +
      facet_wrap(~clust)
• 1 views
•
link
Good work, Chirag!
• 1 views
•
link
Hi Chirag and Kevin,
A simple and naive question on this thread. How do you choose a particular number of cluster (k) before performing kmeans clustering?. I know there are several methods such as pvclust or nbclust to find optimal number of k, but in my experience those doesn't always work better with gene expression datasets. can you please explain your approach
Thanks
• 1 views
•
link
Hi Prakash, as of now I don't have any systematic way to do that. But I use crude way to decide number of K. For example, I check visually (using heatmap or lineplot shown above) if observations in particular cluster behaves similarly. If not, I keep on changing K value till I get convincing clusters.
• 1 views
•
link
To find optimum k, you can try Gap Statistic, Elbow Method, and Silhouette Method. It can take a long time to run these algorithms, though, because they cycle through a range of values of k, testing each value, and also bootstrapping your data in each cycle.
• 1 views
•
link
This post has been deleted by the author
• 0 views
•
link
Log in to answer this question.
Please elaborate on what you have so far. Presumably:
?
Elaborate further.
Hi
1- Yes, I have a count matrix from 15 samples and 5 group, 3 replicates per group, and rows are gene name. The relative expression could be made from log2 counts.
2-Exactly right, I need to make 3-6 cluster, which each gene got a cluster number.
Great, and from where have you taken that figure that you put in your initial question? The term 'standardized expression' could be interpreted in an innumerable number of ways in the context of k-means clustering.
There are also generally many different ways of presenting k-means cluster information:
Thanks Kevin.
Would you please share the R code for my attached image and also above two plots?
The initial plot that you showed was generated with ggplot2, I believe, and using the
facet_wrap()function. I give a quick example of this, but for histograms, here: A: Network/Pathway Analysis from Mass Spec dataThe code for the plots that I showed is here: https://github.com/kevinblighe/cytofNet
You have not answered my other question: "from where have you taken that figure that you put in your initial question?"
It does not appear that you have invested much time in actually understanding what the plot (the one that you posted) is showing.
Dear Kevin,
Thanks for answer and good example. I have found the image from this paper. Yes you are right I've made the code by using ggplot2.
Updated - there is now a tutorial here: https://github.com/kevinblighe/E-MTAB-6141
How exactly did you standardize your gene expession levels?