Thanks,
Do you have any idea of creating such plot with R?
• 1 views
•
link
Hi
I have several questions and I appreciate for answer :
1- I wanted to know how can I add cluster analysis like below image based on read count. 2- Should I run the code only for the genes with minimum number of reads (e.g rowSum(gene) > 10) or I should run it only for DEGs ?
Tnx.
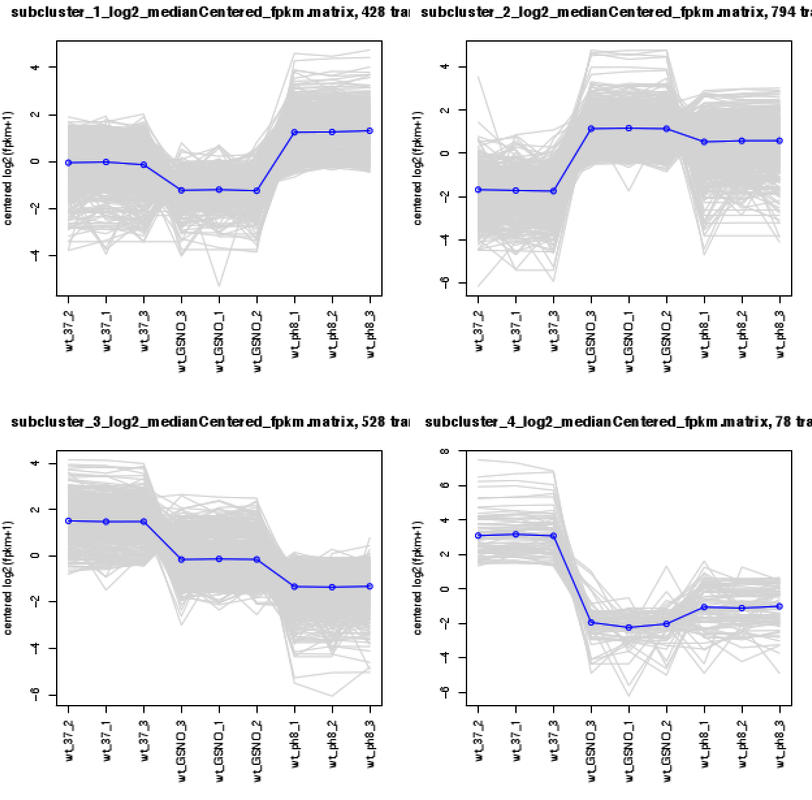
Try out CLUST https://baselabujamous.com/computational-methods/clust/ Read counts, FPKM, TPM etc are accepted in that.
Regarding genes, you might want to leave out genes which show zero or low variance across samples over and above the minimum cutoff for genes.
Thanks,
Do you have any idea of creating such plot with R?
you need to calculate the z-scores ((x-mean)/sigma) for the counts. From this, follow any tutorial on plotting in R. You should be able to get the above plots. With CLUST, you can get similar plots. https://github.com/BaselAbujamous/clust
Hi, First you can find the top genes which are highly variable across the conditions. One way to do this is calculate the standard deviation (SD) across the sample for each gene and then arrange from high to low using SD values. You can choose top 10% or 20% of the genes and later parform k-means on them could give you nice patterns across the samples. The plot I have shown in the another post which is exactly done by this approach.
Log in to answer this question.