Hi all,
I've been using a cox proportional hazard model to do survival analysis in R. I am looking for some advice interpreting the p-values produced by this model. I came across the interesting case where I stratified my data into two groups and the survival curve looked like this:
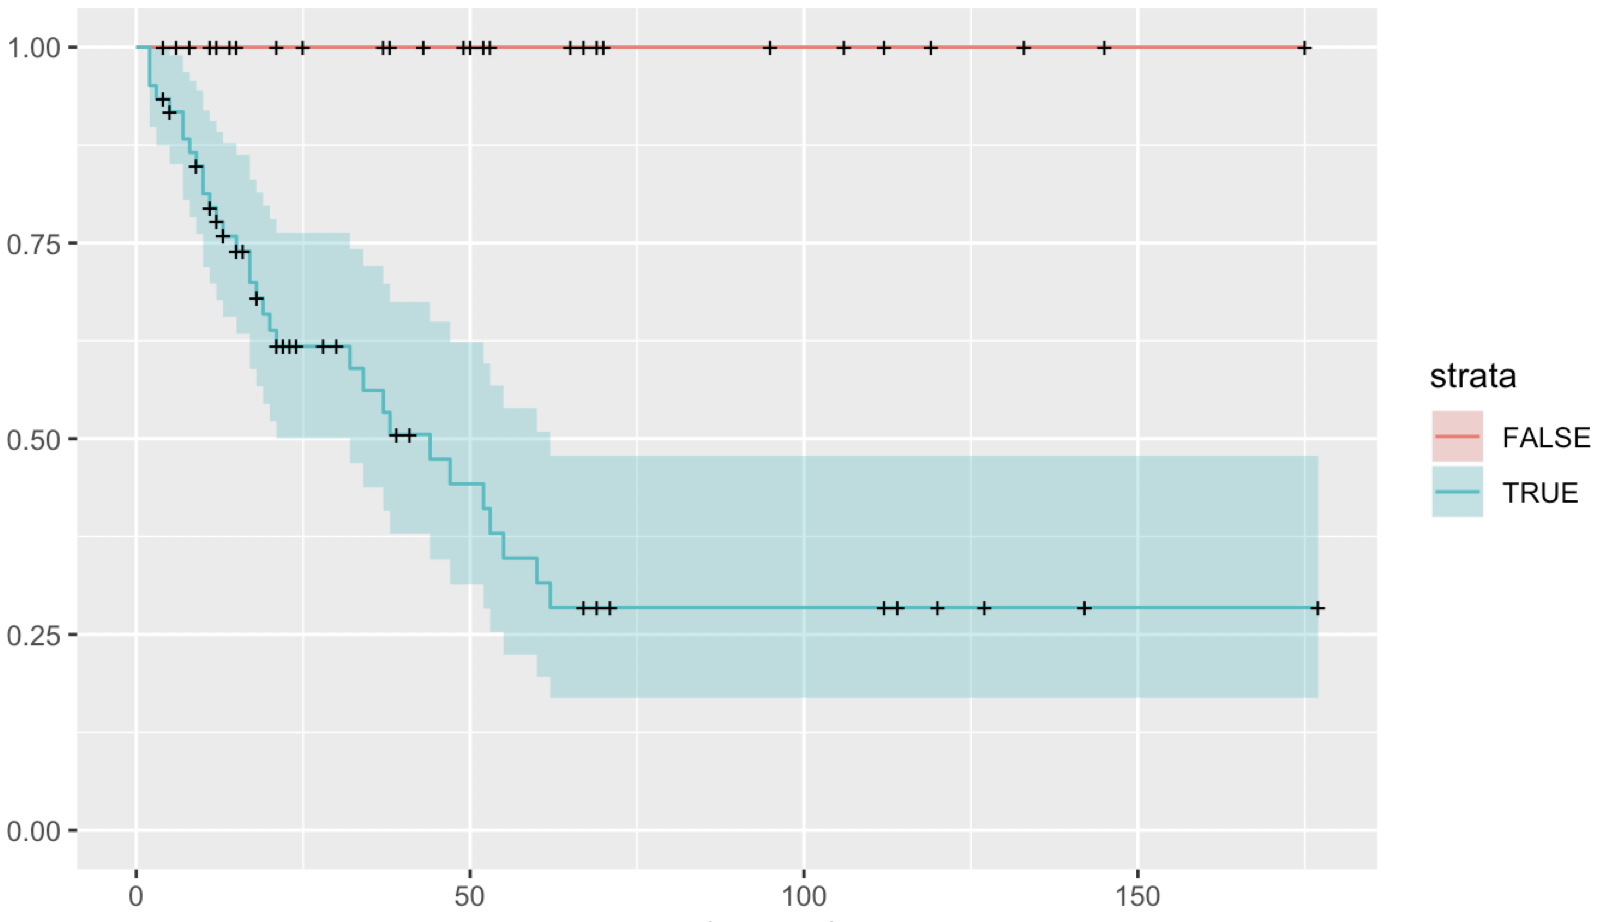
This was generated with code of the form shown below, where var is a binary variable:
km_fit <- survfit(Surv(time, status) ~ var, data=data)
cox <- coxph(Surv(time, status) ~ var, data=data)
When I run summary(cox) I get the following output:
Call:
cox <- coxph(Surv(time, status) ~ var, data=data)

n= 93, number of events= 32

         coef exp(coef)  se(coef)     z Pr(>|z|)
varTRUE 1.991e+01 4.449e+08 4.441e+03 0.004    0.996

    exp(coef) exp(-coef) lower .95 upper .95
varTRUE 444911382  2.248e-09         0       Inf

Concordance= 0.696  (se = 0.047 )
Rsquare= 0.305   (max possible= 0.935 )
Likelihood ratio test= 33.79  on 1 df,   p=6e-09
Wald test            = 0  on 1 df,   p=1
Score (logrank) test = 22.29  on 1 df,   p=2e-06
I was quite surprised that using a Wald test, there was no difference between the groups (p=1) - presumably due to the absence of events in one group. I wonder if anyone could advise me when it is appropriate to use each of these different statistical tests to generate a p-value? What are the underlying assumptions? Is there a good reference on this that you could direct me towards?
Many thanks
r