Going one step further, we could calculate the x-y positions for label and text, instead of hard coding them.
• 1 views
•
link
Hi
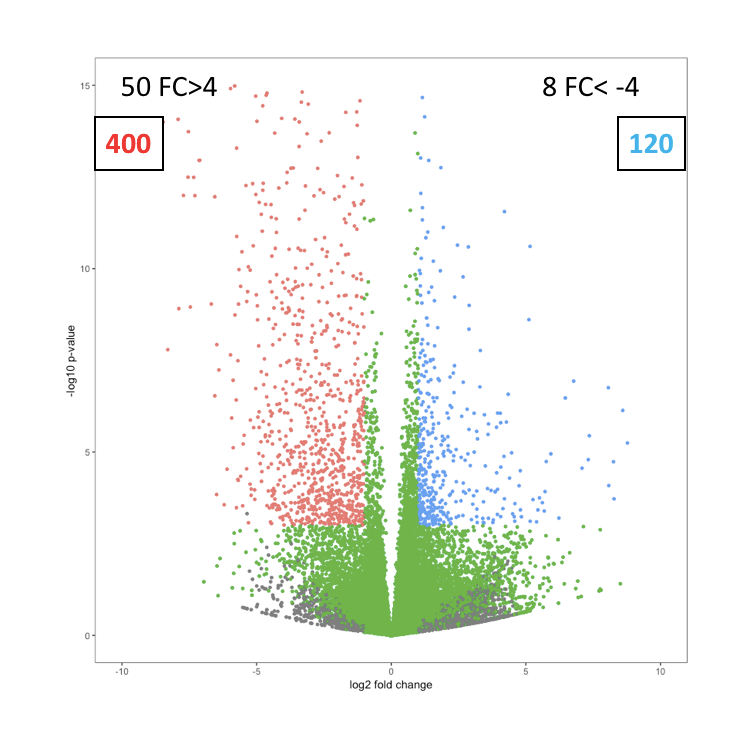
How can I add statistics to volcano plot in R for gene expression? Statistics like up and down number of genes and highly up and down genes.
use example code for that :
library(ggplot2)
fold_changes <- c(rnorm(20000, 0, 2))
pvalues <- runif(n=20000, min=1e-50, max=.1)
dif <- data.frame(fc =fold_changes,pv =pvalues)
dif$thershold <- ifelse(dif$fc > 1 & dif$pv < 0.01, "red",
                        ifelse(dif$fc < -1 & dif$pv < 0.01, -1, "blue"))
ggplot(data=dif, aes(x=fc, y=-log10(pv))) +
  geom_point( size=1 ,aes(color=as.factor(thershold))) +
  theme(legend.position = "none") +
  xlim(c(-10, 10)) + ylim(c(0, 15)) +
  xlab("log2 fold change") + ylab("-log10 p-value")  + theme_bw()+
  theme(panel.grid.major = element_blank(),
        panel.grid.minor = element_blank(),)
Like below image:
try annotate:
ggplot(data=dif, aes(x=fc, y=-log10(pv))) +
    geom_point( size=1 ,aes(color=as.factor(thershold))) +
    xlim(c(-10, 10)) + ylim(c(0, 6)) +
    xlab("log2 fold change") +
    ylab("-log10 p-value")  +
    annotate("label", x =c(-8,5), y = 4.75, label = c("400","120"), col=c("red","steelblue"))+
    annotate("text", x =c(-8,5), y = 5, label = c("50 FC>4","8FC <-4"))+
    theme_bw()+
    theme(panel.grid.major = element_blank(),
          panel.grid.minor = element_blank(),
          legend.position = "none")

By editing x and y coordinates, you can move the text around graph, in x and y directions.
Going one step further, we could calculate the x-y positions for label and text, instead of hard coding them.
Hi
How can we choose proper x-y coordination in code like my example image?
Thanks
thank you so much. It is helpful.
No problem. You have posted input data, code and output expected. This helps in understanding the issue better and resolve it faster. ahmad.moousavi
Log in to answer this question.