Or removeBatchEffect from limma
• 1 views
•
link
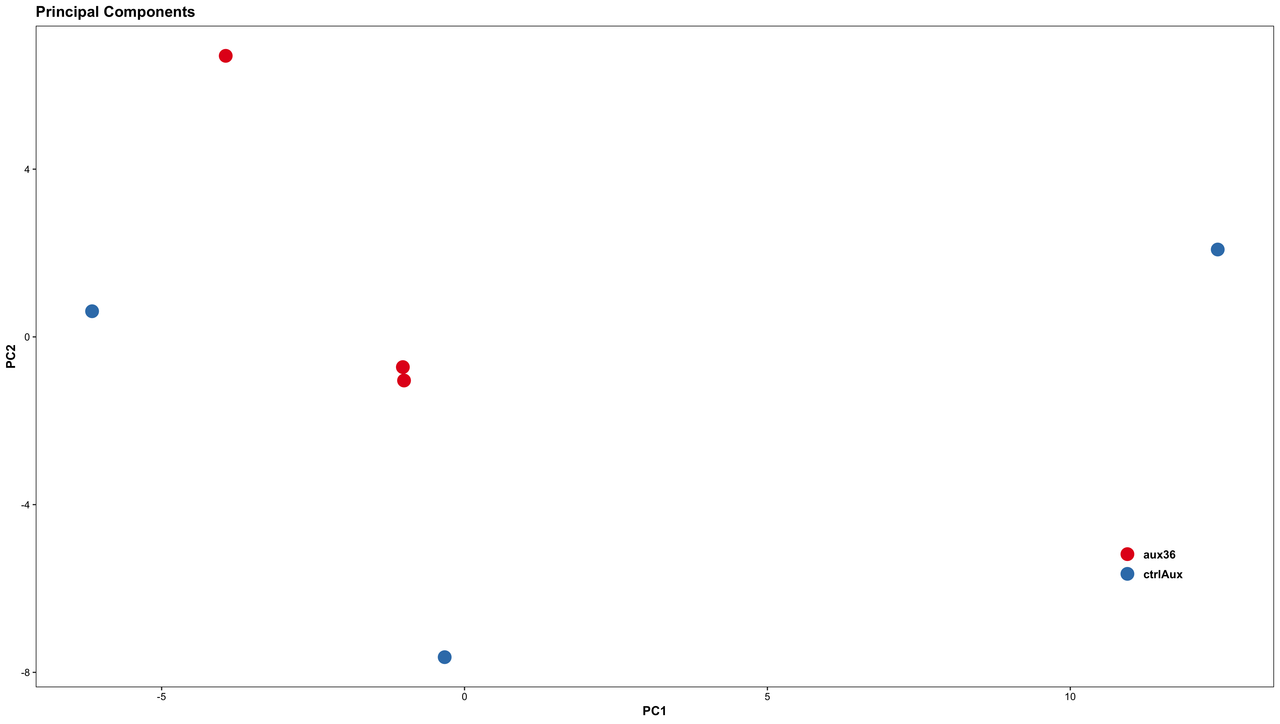
Figure A
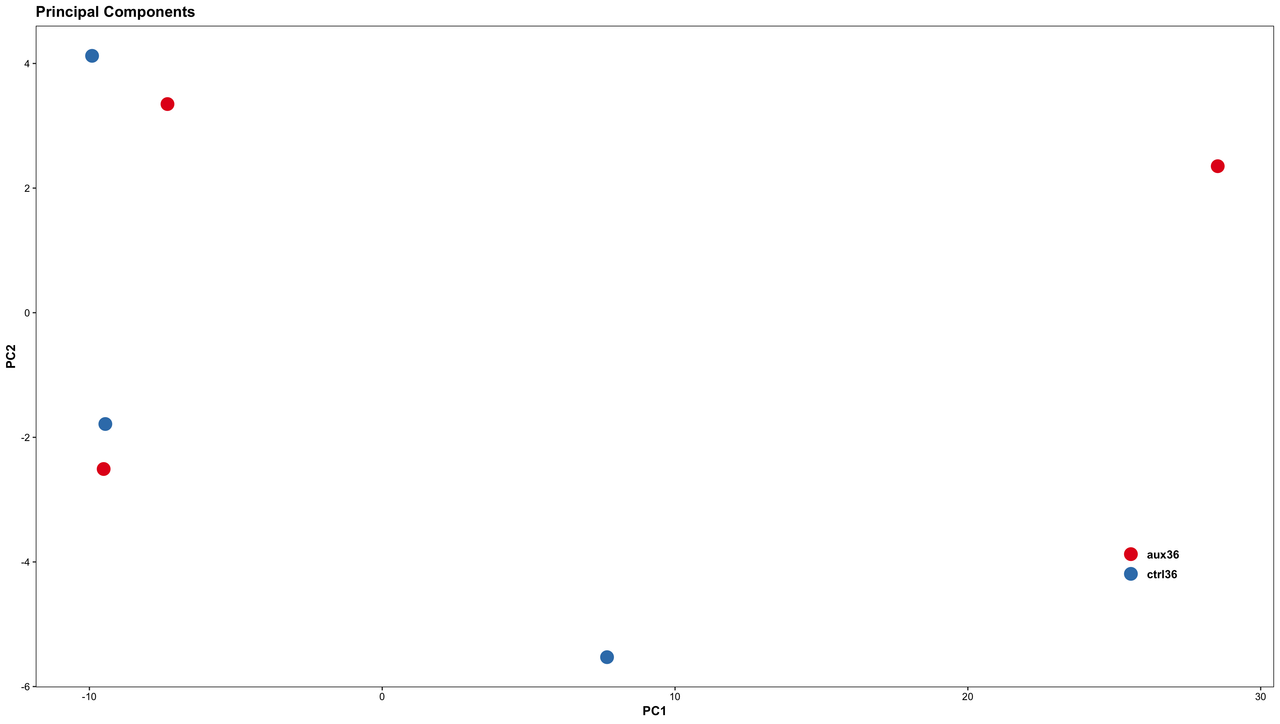 Figure B
The distribution of replicates from an RNA-seq study is plotted on the PCA plot as shown in the figures (plotted using top 500 highly variant genes).
(1) Figure A: Looking at the distribution what is your opinion on carrying out a DE analysis. What type of preprocessing of these samples (please suggest packages/tools) will help in carrying out DE?
(2) Figure B: There is a strong batch effect as the variance between batch is higher than the variance between the conditions compared. I was thinking of comparing sample and treatment of the same batch independently using Gfold or NOIseq and then pull out genes which show similar fold changes between the 3 comparisons. Would like to have an opinion on that. Please comment.
The standard methods for dealing with a batch effect are:
I personally prefer option 1 except in cases where the batch effect is expected to be fairly variable by sample.
Or removeBatchEffect from limma
Log in to answer this question.