ok, thanks! It's a shame this is not a native capability for R.
• 0 views
•
link
Hello - I'm using the ALL dataset from the Bioconductor suite. I'm trying to create a simple graph with 5 separate boxplots that represent the different gene expression between M/F. I can create a single boxplot without any trouble:
boxplot(exprs(ALL)["1043_s_at",]~pData(ALL)$sex)
But when I add another gene I get an error? I thought my syntax looked clean?
> boxplot(exprs(ALL)["1043_s_at","38354_at",]~pData(ALL)$sex)
Error in exprs(ALL)["1043_s_at", "38354_at", ] :
  incorrect number of dimensions
Anyone see a glaring issue with my code?
You would either need to use facets or generate multiple plots and arrange them using gridExtra::arrangeGrob().
You can use ggplot boxplot
geom.boxplot("data",aes(x="put list of genes as factors",y="data",fill="the same gene list as factors"))
Does this create multiple box plots or a single box plot with multiple colors?
One box plot with multiple colors.
Ex:
p<-ggplot(dfa,aes(x=Gene.group,y=Half_Life,fill=Gene.group))+

geom_boxplot(position = position_dodge(.8),width=0.4, outlier.shape = NA,lwd=1)

p+ theme_classic()+ #This is just to make it pretty!
  scale_fill_brewer(palette="RdBu" )+

 theme(plot.title = element_text( hjust=0.5, size=14, face="bold.italic"),
        axis.text.x = element_text(color = "#993333",face = "bold",size=12),#adjsut height,angle
        axis.text.y = element_text(color = "#993333",face = "bold",size=12),
        axis.line = element_line(size = 1),
        axis.ticks = element_line(size = 1),axis.ticks.length = unit(5,"pt"),
        legend.position ="none" )+
coord_fixed(ylim = ylim1*1.05,xlim = c(1:5)) # I set ylim this up other place in the code
See: How to add images to a Biostars post
Code to include your image (needs direct URL to image):
![bar plot][1]


  [1]: https://s22.postimg.cc/u13qmx2tt/a211_all.jpg
which renders the image as:
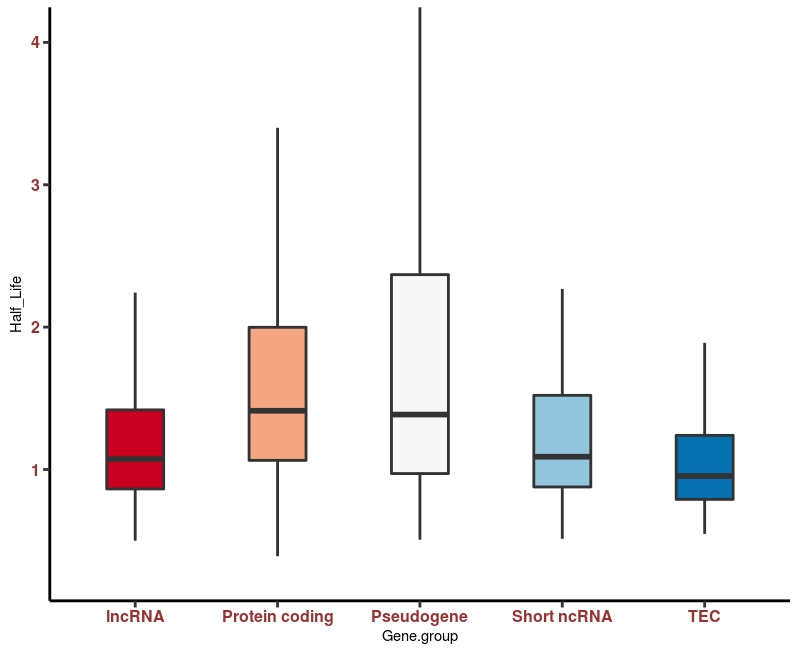
Thanks! First time attaching file.
For basic plotting, you can use par(mfrow=c(1,5)) for 5 boxplots in a window. Example code for 2 below:
par(mfrow=c(1,2))
lapply(c("1043_s_at","38354_at"), function(x) boxplot(exprs(ALL)[x,]~pData(ALL)$sex, main=paste0("Expression of ",x), col=rainbow(2)))
dev.off()

There are two issues in your code:
If you don't want to use, apply functions, you can use following for two boxplots:
par(mfrow=c(1,2))
boxplot(exprs(ALL)["1043_s_at",]~pData(ALL)$sex)
boxplot(exprs(ALL)["38354_at",]~pData(ALL)$sex)
Many thanks, I tried 3 for starters and got an error right away.
> par(mfrow=c(1,2,3))
Error in par(mfrow = c(1, 2, 3)) :
it is par(mfrow=c(1,3). Syntax for mfrow is mfrow=c(rows, columns). rows = number of rows wanted in the graph and columns=number of columns wanted in the graph. Let us say, you are plotting 3 bar plots. They can be row wise, column wise and both.
Both basic plotting and lattice plots support multiple boxplots. Following is example with lattice plot.

library(ALL)
data(ALL)
probes=sample(row.names(exprs(ALL)),6)
library(lattice)
lapply(probes, function(x) bwplot(exprs(ALL)[x,]~pData(ALL)$sex|probes ,scales = list(y = "free")))
Log in to answer this question.