To divide your original data based on the clustering, you can do this (here I generate random data):
data <- replicate(20, rnorm(50))
rownames(data) <- paste("Gene", c(1:nrow(data)))
colnames(data) <- paste("Sample", c(1:ncol(data)))

d <- dist(data, method = "euclidean") #dim(matixmy) 232, 121
hc <- hclust(d)

plot(hc)

g <- cutree(hc, k=6)

names(g[which(g==1)])
 [1] "Gene 1"  "Gene 2"  "Gene 7"  "Gene 8"  "Gene 9"  "Gene 10" "Gene 16"
 [8] "Gene 18" "Gene 20" "Gene 24" "Gene 27" "Gene 34" "Gene 35" "Gene 36"
[15] "Gene 39" "Gene 43" "Gene 44" "Gene 46" "Gene 48" "Gene 50"

data.clus1 <- data[names(g[which(g==1)]),]
data.clus1[,1:5]
             Sample 1     Sample 2     Sample 3    Sample 4    Sample 5
Gene 1  -0.3265533798 -0.353788700 -1.252597406  1.02673012  0.78063500
Gene 2   0.3894123896  1.287610679  0.510763521 -0.41776115 -0.07522766
Gene 7  -0.3502039599 -0.054720953 -0.866460675 -1.53013823  0.88244826
Gene 8   0.5703786887 -0.730078360  0.073504515 -0.16464475 -0.43750484
Gene 9   0.0009042849  0.160435234 -0.729832035 -1.82075100  1.23383174
Gene 10  0.8403966124  1.047750927  0.592436038 -0.43713363 -0.70182272
Gene 16 -1.2432953888 -1.071980681  0.465425922  2.07541867 -2.14403843
Gene 18 -0.0446571980  0.329836350 -0.439705377 -2.18505552  0.25679223
Gene 20 -2.0107250315 -0.085088554  0.142902875 -1.11932036 -1.20391413
Gene 24  0.0035652976  0.313601613 -0.007974485  0.78838515 -0.26814648
Gene 27  1.0571817267 -1.525753500 -1.298142377 -0.14882204 -0.18546145
Gene 34 -1.2390634629  2.065688036 -0.503428684 -0.47974532 -0.10128702
Gene 35 -0.9853974196 -1.614916506 -1.995684116 -1.26023029  0.35043024
Gene 36 -1.8284639443 -0.333458263 -0.435001541 -0.89361539  0.72974594
Gene 39 -0.5316389059 -0.006727708  0.997842431  0.22530868  0.91806786
Gene 43 -0.9923273610 -0.407900015 -1.617834400  0.65051190 -0.46099219
Gene 44 -0.3936848429 -0.522017104 -0.512397019 -0.26706115 -0.53908429
Gene 46  0.6143568276 -0.057919155 -1.407929426  0.08260024 -2.37762996
Gene 48 -0.5401317577  1.445300993 -0.034920714  0.10447368  1.05554193
Gene 50  0.7484196524  0.270700166 -0.859674703  0.21166880  1.43766975

data.clus2 <- data[names(g[which(g==2)]),]
data.clus2[,1:5]
          Sample 1    Sample 2   Sample 3   Sample 4   Sample 5
Gene 3   0.2202918  0.05289355 -0.7730082 -1.0181504 -1.4074479
Gene 25 -1.0449318 -1.17589940 -0.3072553 -1.5618628  0.8176866
Gene 26  1.1615993  0.20727857 -2.9046389  0.4583936 -0.1916534
Gene 31  0.3505871  0.75520916  0.1726550 -0.5983129  0.1327144
Gene 45 -2.2247328 -0.23420779 -1.0515205 -0.8389772 -1.3951449

data.clus3 <- data[names(g[which(g==3)]),]
data.clus4 <- data[names(g[which(g==4)]),]
data.clus5 <- data[names(g[which(g==5)]),]
data.clus6 <- data[names(g[which(g==6)]),]
Kevin
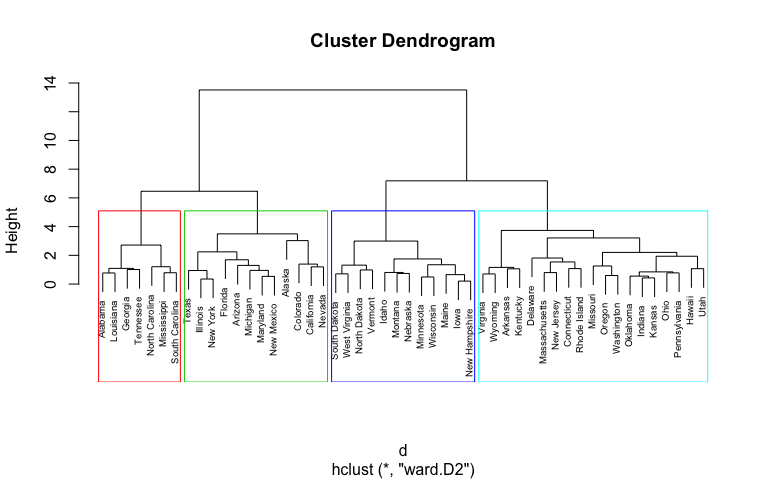
See: How to add images to a Biostars post - you'll need the image URL, not the google referrer URL with the search result page.
Here, the image URL is https://uc-r.github.io/public/images/analytics/clustering/hierarchical/unnamed-chunk-13-1.png
And you'll use the image option on the toolbar, not the external link option. Once done, it should look like this:
I've deliberately made the above image small so it is not usable. You can follow my lead (and my how-to post above) and make it any size you want to.
I see, very clear! Thanks!