Hey all,
i have a specific need to cluster more than 1K genes based on their expression profile. I want to extract then just the genes in clusters with the same expression profile. My first attempt was to set the optimal K with gapstat and using kmeans to mark my expression atlas with the cluster identifier and then extract the genes from a specific cluster by subsetting the dataframe. This didnt work because kmeans tries to put together genes even with different expression profile.
So do you have any suggestion to accomplish this?
Summarizing :
- i want to cluster a big expression atlas
- extract the gene IDs with similar expression profile
thanks in advance
p.s.
i saw this post https://support.bioconductor.org/p/93424/ about pheatmap which would be ideal but i cannot figure out how to check the clusters identifier in order to use cutree function
1 answer
Hi,
You could use your kMeans approach then score the individual genes by comparing them to the centroid.
First get the centroids:
# function to find centroid in cluster i
clust.centroid = function(i, dat, clusters) {
  ind = (clusters == i)
  colMeans(dat[ind,])
}
kClustcentroids <- sapply(levels(factor(clusterdata$cluster)), clust.centroid, scaledata, clusterdata$cluster)
where clusterdata is the result of kmeans and scaledata is your expression dataframe.
Then compare the genes to the cluster cores:
#get just cluster 2
K2 <- (scaledata[clusterdata$cluster==2,])
#get cluster 2 core
core <- kClustcentroids[2,]

#compare them with cor
corscore <- function(x){cor(x,core)}
score <- apply(K2, 1, corscore)
The scores will relate to how close they match the cluster core (from 0 to 1). Here's an example of plotting them:
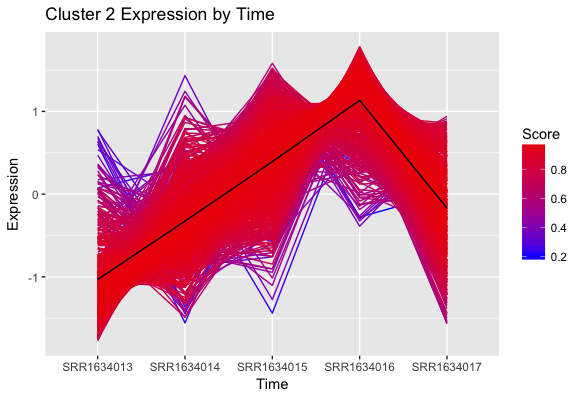
Then you could just take the genes with a score above a certain cutoff (like 0.75). Complete workflow here
Good luck!
Log in to answer this question.
Hi,
in the example from Bioconductor the object after cutree execution contains the genes with the cluster identifier (a number from one to n - an integer you have chosen for cutree).