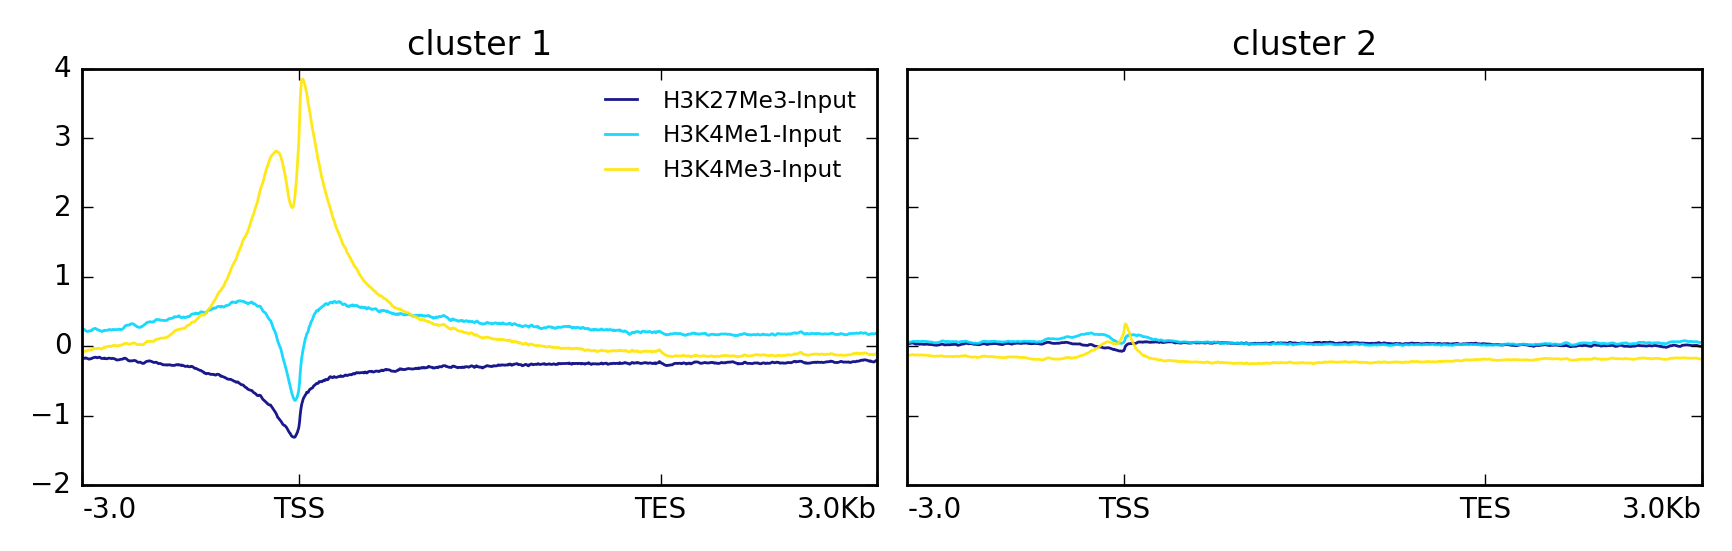
Nice but what's on the y-axis? Is it relative per-transcript read coverage? Why is it negative? It is a nice tool, but what I'm really looking for is a transcriptome-wide assessment of uneven transcript coverage, as a quality assessment of 5' degradation. I guess I will just leave this question open for a few days then I will write a package for it.
Show RNASeq coverage distribution over transcript length
Hi all!
I have RNASeq data aligned over a transcriptome in BAM format. Provided the gene annotation (GTF, GFF3), do you know of any tool that can show global transcript coverage with respect to the transcript length?
I would like to quantify any uneven transcriptome-wide transcript coverage, specifically between the 5' and 3' ends of transcripts.
The plot should look like this (I made it up with random data, but you get the idea):

• 2,599 views
•
link
1 answer
You can use deeptools plotProfile along with deeptools computeMatrix and the scale-regions option. This can give you something like this (TSS= 5' end, TES= 3' end).

• 1 views
•
link
• 1 views
•
link
Log in to answer this question.