Small dispersion values in differential expression analysis
Hey everybody,
I have read in many papers that small dispersion values are correspond to small normallized mean read counts. And high read counts with a high dispersion value. But when I see the graph of these realation ship, I observe a another result. For example here: https://app.dimensions.ai/details/publication/pub.1085595540
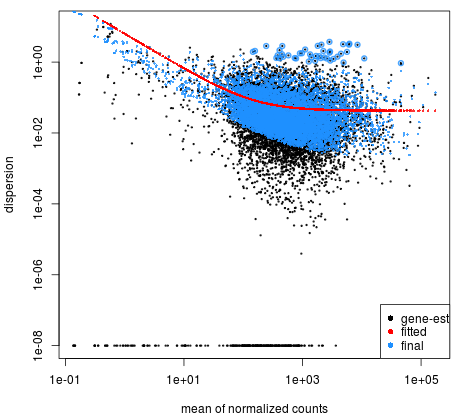
So what is my fault of the understanding.
• 2,861 views
•
link
1 answer
See [one of possibly many] answer[s], here:
Kevin
• 0 views
•
link
Log in to answer this question.
The dispersion is the squared coefficient of variation (CoV^2). There's an easy interpretation of this here: https://support.bioconductor.org/p/75260/#75276
Low counts may exhibit higher dispersion just as they may also exhibit inflated fold-changes when comparing across groups. This is why dispersion needs to be accurately modelled, as is performed in EdgeR and DESeq2, and also why fold-change shrinkage occurs, i.e., in order to deal with these issues of low count genes.
What you've written may have been taken out of context. Can you quote the exact passages that you've read?
I have the same question -- hoping to get some other responses here.
What is the specific question? - please confirm that you have read the original publication: Moderated estimation of fold change and dispersion for RNA-seq data with DESeq2
You created a new question: RNA-seq data: Contradictory counts vs. variance/dispersion trend?