Loop Rowan in to new emails to PI
Ideogram.js is a JavaScript library for chromosome visualization.
Ideogram supports drawing and animating genome-wide datasets for human, mouse, and many other eukaryotes. The Ideogram API for annotations supports histograms, overlays, and points of arbitrary shape and color layered in tracks. Ideogram can depict haploid, diploid or higher ploidy genomes (e.g. plants), as well as aneuploidy, genetic recombination, and homologous features between chromosomes.
Ideogram can be embedded as a reusable component in any web page or application, and leverages D3.js and SVG to achieve fast, crisp client-side rendering. You can also integrate Ideogram with JavaScript frameworks like Angular, React, and Vue, as well as data science platforms like R and Jupyter Notebook.
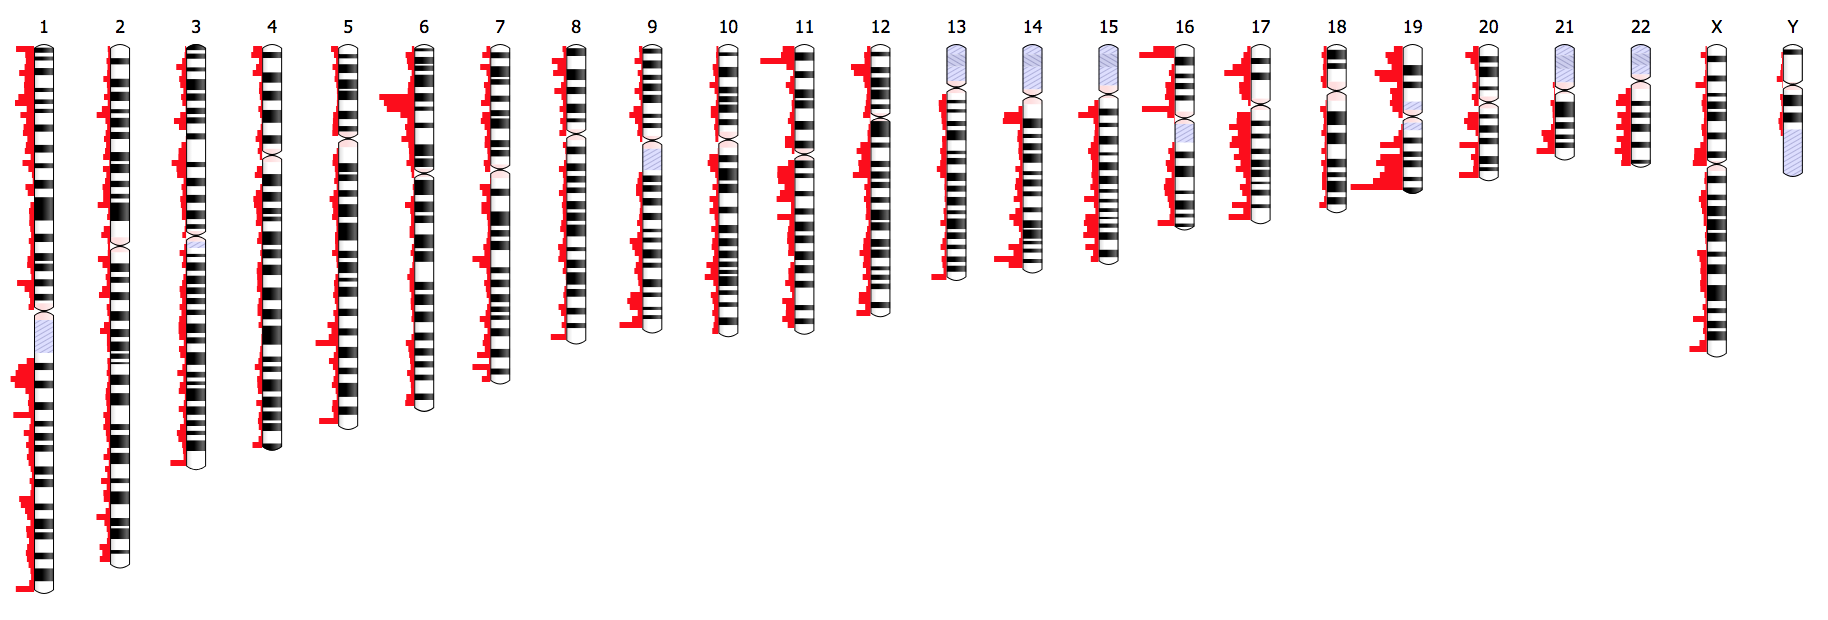
Check out live examples, get up and running with your own deployment, skim basic usage, or dive into the full API!
0 answers
No answers yet.
Log in to answer this question.
Very nice, Eric.