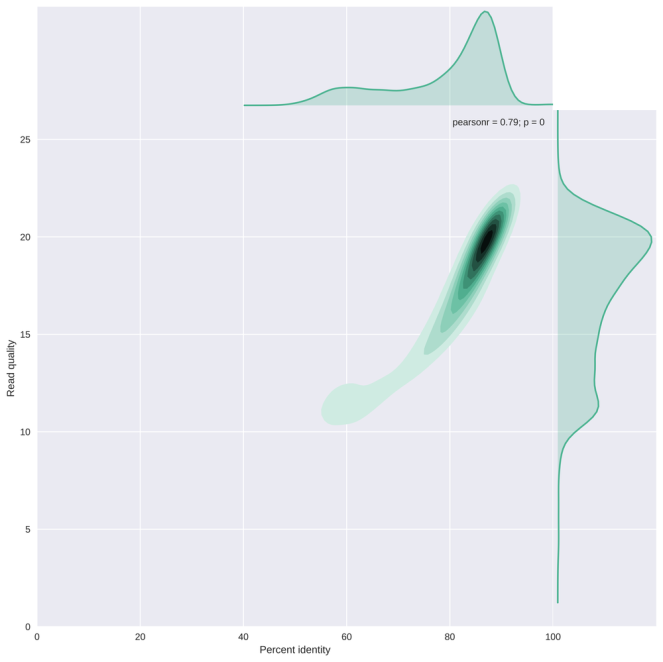
Seems your Nanoplot shall do the needful. I am looking for something similar you have performed here : https://gigabaseorgigabyte.wordpress.com/2017/06/01/example-gallery-of-nanoplot/ , the average read quality.
As mentioned by you, you have performed : Per base sequence content and quality what are these value in the y-axis , if these values are Phred scores then Q30 is usually considered to be as cutoff for good quality read. In your plots all the bases shows quality value of 8, I want to know ,what threshold are you using as cut-off for good quality reads.
• 0 views
•
link