Entering edit mode

7.4 years ago
eyb
▴
250
I have calculated statistics for snps using selscan and some other software.
> pos   gpos    p1  ihh1    p2  ihh2    xpehh   normxpehh
> rs13303118    918384  2.48676 0.407895    0.111293    0.540404    0.119766    -0.0733738  -0.566022
> rs2341354 918573  2.48727 0.302632    0.118606    0.565657    0.121548    -0.0245079  -0.291094
> rs6665000 924898  2.50465 0.0394737   0.142359    0.964646    0.142042    0.00223109  -0.140656
> rs2341362 927309  2.51128 0.0394737   0.142359    0.964646    0.142042    0.00223109  -0.140656
I want to create a dot plot and add gene annotation below x-axis? Which is the best way to do it?
I want something like this:
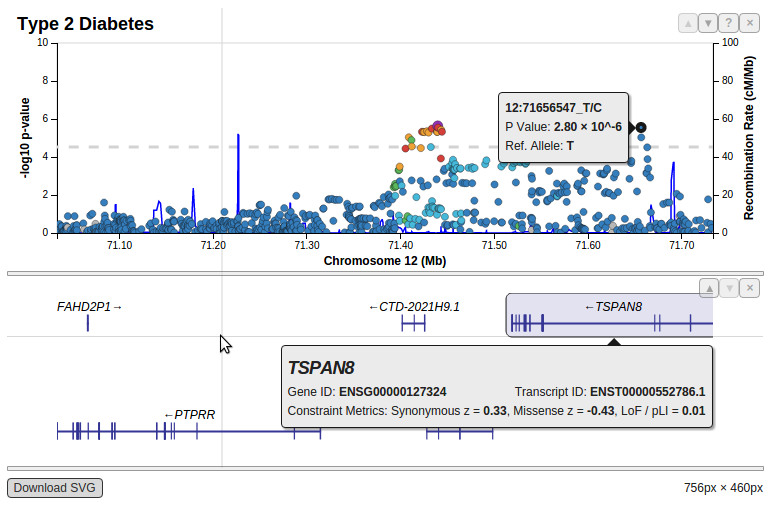
This image was created in Locus zoom program. But I wanted to use python or R for the job. Are there any libraries which would allow to do similar plots?