Hi all,
I have generated VCF files from a range of samples of my study organism using a published reference genome. I now want to use these to assess where diversity is along a given chromosome; in other words I want to know the density of SNPs along chromosome 2.
One way I had thought of doing this was to split the chromosome into 10Kb chunks, count the number of SNPs in each one, and plot this in a chart. So what I want is basically:
Chr2:1-10000, SNPs = X
Chr2:10000-20000, SNPs = Y
etc.
But I can't figure out an efficient way of actually extracting this information from my VCF files.I am able to use the command
tabix -h myfile.vcf.gz chr2:[10Kregion] > myoutput.vcf
to extract a given region of any VCF file and then use bcftools stats to count the number of SNPs therein, but the chromosome is 16Mb long; there must be a more efficient way to do this than for me to manually extract 1,600 VCF files and examine them with bcftools stats.
I wonder if there's some software that could help with this. I have Integrated Genome Viewer, MEGA and SeaView, but if any of them have this kind of functionality, I haven't found it yet.
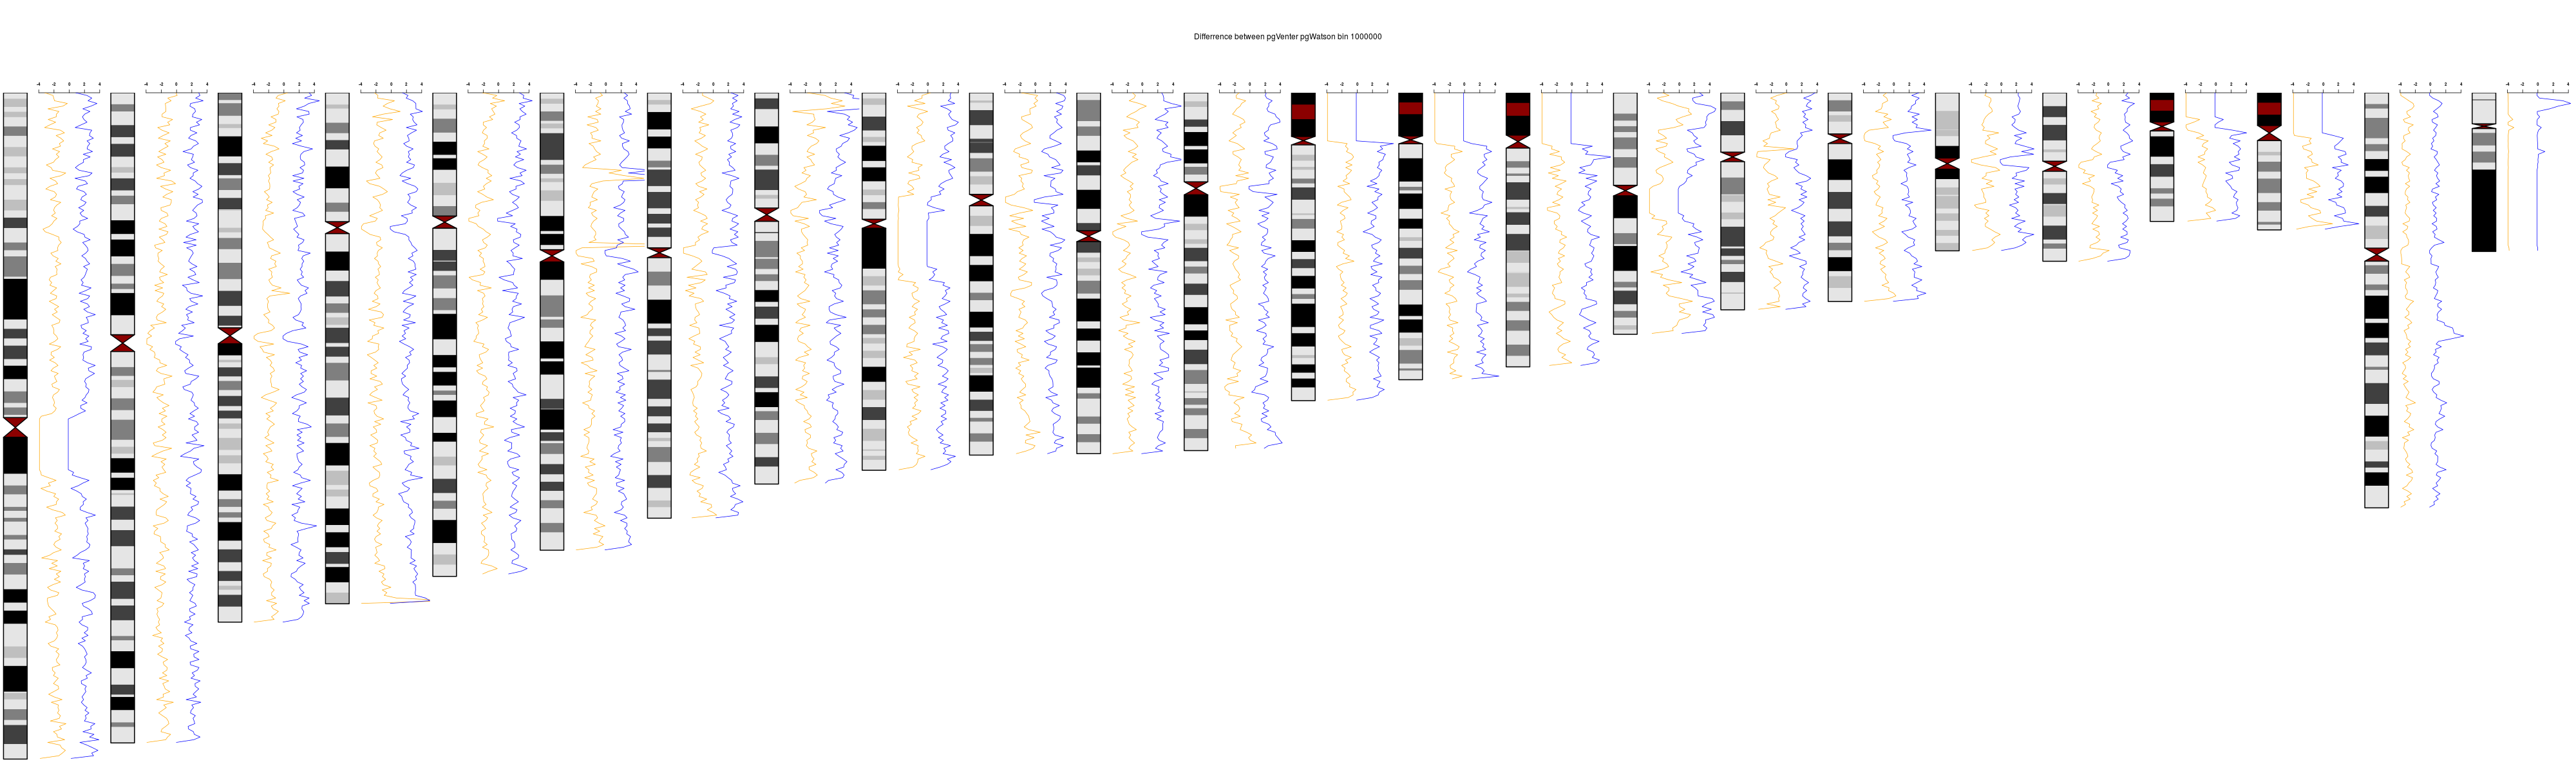
Otherwise, any help or advice would be much appreciated. It must be doable because I see plenty of published papers with SNP density plotted against chromosome position, but I can't figure out how to do it myself.
Thanks in advance!
snp
genome