How to detect poliploidy or aneuploidy in yeasts?
2
0
Entering edit mode
8.1 years ago
agata88 ▴ 870

Hi,

I am working on NGS Illumina fastq results for 2 strains of unknown yeasts. I would like to find out what kind of genotype they are presenting. What is the best way to find out whether strains are poliploid or aneuploid? Is samtools and bcftools with -m option a good way to do that?

I would appreciate for any help.

Best regards. Agata

yeasts ngs genotyping bcftools • 2.5k views
ADD COMMENT
0
Entering edit mode
6.9 years ago
Wayne ★ 2.0k

Found this year old question when I was wondering the same thing, and so I'll put this here for anyone else...

You don't say what type of NGS data you have? If DNA sequencing, than maybe see: : "Genotyping 1000 yeast strains by next-generation sequencing" or The Genome Sequence of the Jean-Talon Strain.... My own example and the one I have a reference for had RNA-Seq data from baker's yeast Saccharomyces cerevisiae, and so I'll answer further in detail for that. (Obviously this organism as the benefit of a highly-characterized genome and transcriptome, which the original poster may not have for "unknown yeasts"(?). In that case maybe relating to orthologs in the closest, well-characterized organism in a similar way may help with RNA-Seq results?)

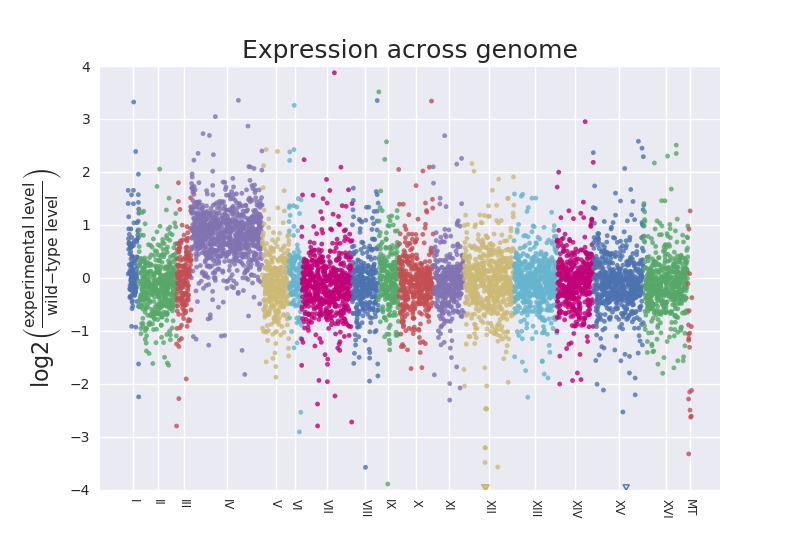
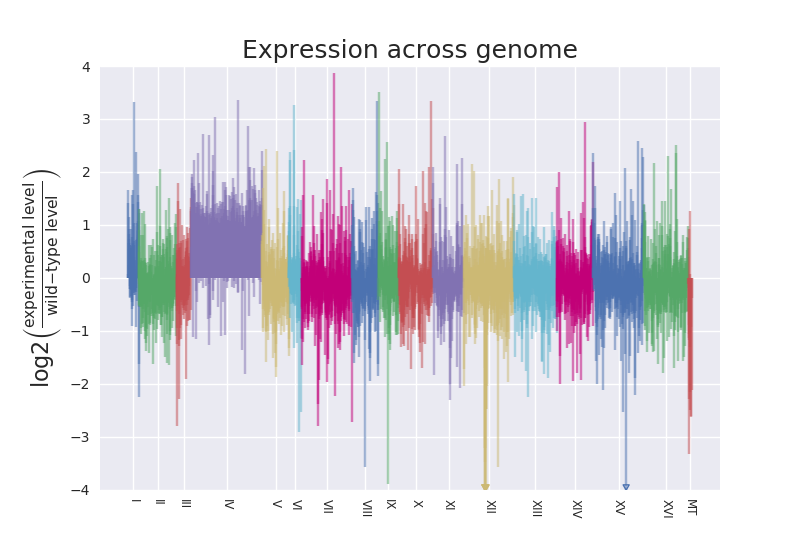
There is a representation of Log2 Fold Change across chromosomes to illustrate encountering disomy in this paper using RNA-Seq results: Ryu H-Y, Wilson NR, Mehta S, Hwang SS, Hochstrasser M. Loss of the SUMO protease Ulp2 triggers a specific multichromosome aneuploidy. Genes & Development. 2016;30(16):1881-1894. doi:10.1101/gad.282194.116. https://www.ncbi.nlm.nih.gov/pmc/articles/PMC5024685/ PMID: 27585592

They say this was an unexpected result in paragraph three of the results. I don't know if such a plot is indeed how they first noted the duplication. We had noted one in our case when we sorted a spreadsheet of normalized count assessments by the S. cerevisiae systematic gene names and made a column of the ratio of levels for one strain vs. the wild-type. For an entire chromosome that ratio hovered around 2.0.

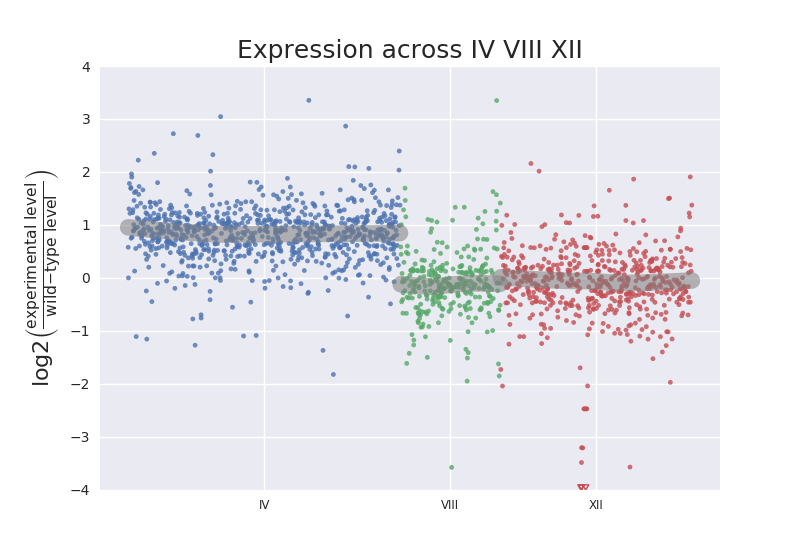
A different form representation than the one I cited above is shown in Figure 5B of: Aneuploid yeast strains exhibit defects in cell growth and passage through START. Thorburn RR, Gonzalez C, Brar GA, Christen S, Carlile TM, Ingolia NT, Sauer U, Weissman JS, Amon A. Mol Biol Cell. 2013 May;24(9):1274-89. doi: 10.1091/mbc.E12-07-0520. Epub 2013 Mar 6. https://www.ncbi.nlm.nih.gov/pmc/articles/PMC3639041/ PMID: 23468524

One thing I'll add is that this seems like checking for this sort of thing should be standard for analysis of results from Saccharomyces cerevisiae data given there are several reported cases pointed out by the reference above. Maybe even for other organisms. Is it? I had submitted my list of statiscally "up-regulated" genes to several sites that offer the service of taking lists of gene sets and returning summary classifications, and nothing came up that even hinted there was a chromosome duplicated. Lots about possible functions and processes enriched. In fact, I felt I had missed the forest from the trees when it was pointed out that I had a chromosome-specific disomy. It was really obvious in retrospect that I had in excess of 500 genes from a single chromosome out of 800 classified as up-regulated just by searching the list in text form with regular expressions to look for YB at start of line. It seems easy to check for such events, at least at the chromsome level, by seeing if enrichment occurs for a chromosome in the list of differentially expressed genes, similar to the detailed analysis script I wrote for classifying yeast snoRNA enrichment. You can see example output to the command line for that script here.

I have used derfinder to identify differentially expressed regions without regards to gene annotations for another project, and it seems to focus on chromosomes as the standard units of analysis. It will summarize expressed units per chromosome as part of its analysis, and I imagine then it would would result in differential expression across the chromosome as well for such a case, but I have not tried this data with derfinder yet to see.

Related to this topic:

  • I found this post from Istvan Albert that looked for segmental duplications from exome data.
  • I found this post on methods for copy number variation with exome data.
  • I found this post questioning if it is possible.
  • I found this post also questioning if it is possible, but I think they are focusing on gene level copy in the responses.
  • I found this post with an example of a 2014 paper detecting copy number variation from an entire chromosome arm, but the discussion there makes me thinks looking for this isn't standard.

I'd be really curious what anyone else has to say or add on this subject? Is there a tool others have used that checks for enrichment of genes located on chromosomes or certain segments from RNA-Seq data? Mainly looking for yeast which is why I posted here.

ADD COMMENT
0
Entering edit mode
6.8 years ago
Wayne ★ 2.0k

UPDATE, PLUS A SOLUTION OFFERED:

Historically, T-profiler has been used to run an Aneuploidy check with expression ratios of yeast genes. We found two problems with this. It was our experience that it no longer seems to allow you to upload your own data. Even if you try it with the Saccahromyces cerevisiae test file entitled, aneuploidy pdf2_14 (Hughes et al.), and hit Aneuploidy Check you get a graph error. We looked at g:profiler for a newer site addressing a similar need and didn't see an equivalent of this ability. I'd be curious if I missed anything there?

For RNA-Seq data, I had seen DESeq2 can be used to plot fold changes in genomic space; however, it requires reading in data with summarizeOverlaps, as described here. Reading in data with summarizeOverlaps is just one of many of the routes to supplying count matrices into DESeq2. Additionally, you need to define gene models from GTF files by also constructing a TxDb object in DESeq2 prior to even being able to use summarizeOverlaps to generate count matrices. Similarly, NOISeq produces Manhattan plots for chromosomes as shown in Figure 3 here, but then you are tied to NOISeq or have to do the analysis with at leat two different packages to get such a plot.

Not finding anything broadly suitable, I implemented a Python-based plotting approach that borrows a lot from Brent Pedersen's awesome manhattan-plot.py script here. (Many thanks to him for sharing that!) My scripts are found here add produce a plot similar to a combination of Brent Pedersen's manhattan-plot that can be seen here and the plot in Figure 5B from Thorburn et al. 2013 (PMID: 23468524) that can be seen here. Which form of the script you use depends on what state your data is in. If it is raw from Salmon or other RNA-Seq quantification software, you can point plot_expression_across_chromosomes_direct.py at your quantified data for wild-tye(baseline) and experimental samples. If you have multiple replicates and therefore multiple data files, it will combine them and use the mean in the ratio relative wild-type to plot.If you have already combined your data for your sample in manner, perhaps into a spreadsheet indexed on the gene identifiers, you can use plot_expression_across_chromosomes.py and specify the columns for gene identifiers, wild-type and experimental samples.

Example result:enter image description here

Example of same data with different options: enter image description here

Importantly every effort was made to make these scripts pipeline agnostic. Plus they aren't limited to yeast. For example, although plot_expression_across_chromosomes_direct.py defaults to assuming Salmon-quantified data, you can supply an optional flag --data_column to specify a particular column to use as the expression level. My scripts are meant to eliminate the need for any additional steps, such as require linking to taxonomic data, but still allow producing such plots no matter your pipeline. You can still use DESeq2 if you choose but with this script you aren't tied to using summarizeOverlaps and have the option to use any method, say tximport, to bring in counts. In fact, with plot_expression_across_chromosomes.py, any method to produce a ratio of expression for a sample relative a baseline sample should work to be able to plot and the script may even be applicable to summarized microarray data. They use standard genome annotation files for the gene and chromosome information, and so they should be applicable to most organisms.

Subsets of chromosomes can be plotted as well: enter image description here

SUMMARY:
A python-based approach for any pipeline and almost any organism can be found at https://github.com/fomightez/sequencework/tree/master/plot_expression_across_chromosomes

ADD COMMENT

Login before adding your answer.

Traffic: 3252 users visited in the last hour
Help About
FAQ
Access RSS
API
Stats

Use of this site constitutes acceptance of our User Agreement and Privacy Policy.

Powered by the version 2.3.6