the library is nice ....
• 0 views
•
link
I am trying to compiling we resources for creating excellent visualization tools for bioinformatics use. The following are some of official graphics gallery I have found:-
Specific plot library
R / ggplot2
Blogs
R blogger, ggplot2 tag R blogger Lattice tag
Are there other important library that are useful and specific to bioinformatics application? I think R should have better resources in this context. ..
One of my favourite graphics site:
One visualization library related to chip-chip and chip-seq data, is the hilbertviz package.
See the R/Bioconductor View for visualization. I especially like GenomeGraphs.
You should also consider matplotlib
the library is nice ....
Hi,
I just dug a bit into my delicious bookmarks and found this few resources.
I hope this helped.
That's pretty slick. Is this related to PyMOL (http://www.pymol.org/) somehow?
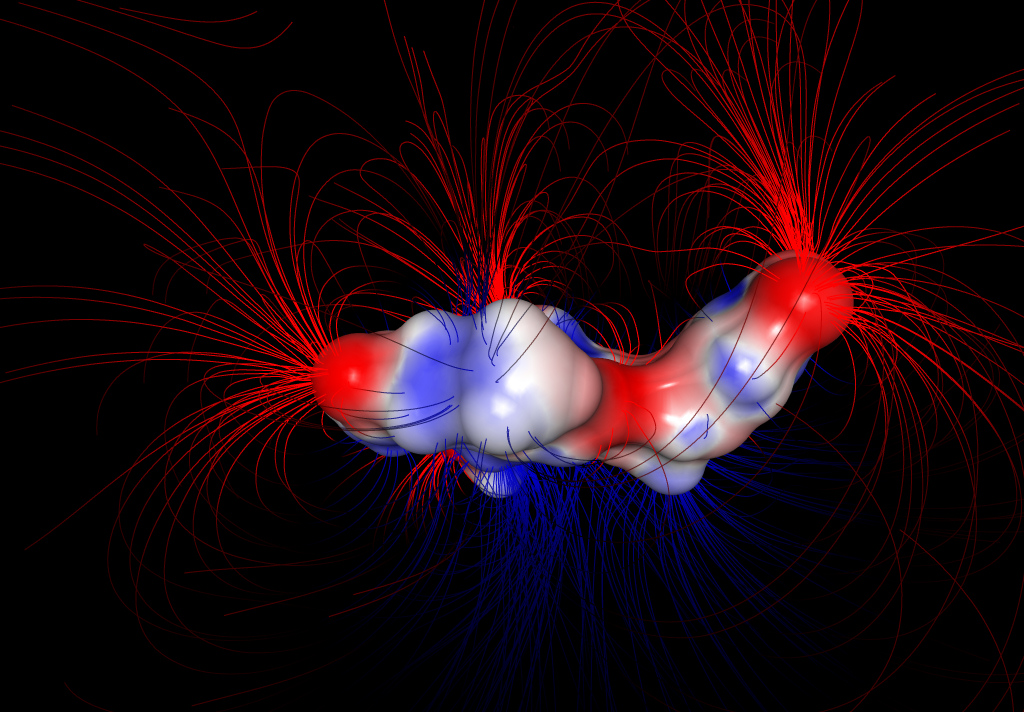
The gallery has interesting stuff: http://www.ballview.org/Gallery
There is python code, but I do not know of any connection to pymol. It is part Biochemical Algorithms [BALL] package.
Here are some generic ones:
Specialized:
I've been using d3.js a lot. It's a great javascript library that you can use to create charts and diagrams in SVG format. Add Firebug or Chrome's console abilities, and you have a really nice method of creating your figures because you can step through your code and debug easily with the visual changes reflected instantly.
Here is a great beginner's tutorial for it assuming you have some knowledge of browser languages:
http://www.recursion.org/d3-for-mere-mortals/
Here is a really great video tutorial:
Lots of examples here that you can try out: https://github.com/mbostock/d3
Some python libraries:
Also, colorbrewer, pointed by russH, is a resource to choose good color palettes. It is useful when you have to draw a graph of some data and you want to know which colors to choose.
I think you wish (like me) that you had attended the Vizbi conference last week in Heidelberg: http://vizbi.org/
I think their unofficial aim is to increase the beauty of science :)
Luckily they have already uploaded some beautiful posters & I'm sure that some amazing talks will be uploaded too.
whow !!!!! I wish I had attended this ...I see some videos as well ..nice
There are two resources by Publishing Houses, that provide image search in articles. One from Springer - SpringerImages. Second is from Cell - CellImageLibrary. Of course they do have bioinformatics images.
If using python, consider the seaborn package (gallery here) which is built on top of matplotlib. It includes heatmaps, many statistical plots including linear models, mult-faceted/grid plotting, and color palettes (including colorbrewer). It leverages the pandas DataFrame object to make it easier for plotting then standard matplotlib. Personally, I like the figure aesthetics more than ggplot2.
For color palette selection of charts, I use: IWantHue "Colors for data scientists"
They do k-means clustering of colors in a selected range to achieve maximum divergence between the individual colors. However, you can keep colors and re-cluster and similar thing to make it suit your needs.
That's really good, I always struggle with this.
If you want to create animations or explore high-dimensional data, GGobi is the tool to use. You can use it in R (package "rggobi") which is a great convenience. I would highly recommend a visit to r-forge, where you can search through lots of interesting projects with a wide range of bioinformatics applications.
For general plotting, you should consider GD, though you probably already have it if you generate graphics in BioPerl. Since you mentioned Perl, there is a great list of relevant modules on CPAN.
Though Its not related directly to Bioinformatics, still this site shows 50 great data vizualizations. We can implement these ideas on bioinformatics data with any of the tools listed above.
http://www.webdesignerdepot.com/2009/06/50-great-examples-of-data-visualization/
I am developping a new R graph gallery. Have a look to
http://www.r-graph-gallery.com
All the best !
You can use PathwayBuilder at http://www.proteinlounge.com or ePath3D which is available at the same site.
Dear John,
I wrote this program to help me in my research: http://i-pv.org/
In a nutshell: it displays most protein features you can think of in an interactive interface that works for PC/mobile.
Here is an example: http://i-pv.org/FOXP2.html
Here you will find more examples and tutorial videos: http://i-pv.org/ipv_minimal.html
Regards
Rcharts looks pretty cool. It's not really specific to bioinformatics though.
http://rcharts.io/gallery/
Log in to answer this question.
Fairly related question asked recently here: http://biostar.stackexchange.com/questions/18378/packages-for-visualization-of-biological-data-in-r
it is not related ..but not exactly...but discussion over there is relevant too..i am trying consolidate all visualization resources but not only R specific or program specific
http://colorbrewer2.org/
@malaching question is related but not exactly - as the question directed has attention on R packages not whole facinating world...also this question aims to collect gallery ...still discussion at your link is relevant too...
I just posted a demo and some sample javascript code for displaying gene ontology as a force-directed graph using d3.js on my blog: http://blog.nextgenetics.net/?e=19