This may work out for me! Do you know if the graphic output I pasted above was developed with this package?
• 0 views
•
link
I am new at using R for bioinformatics and have to generate graphics for the genome of yeast, with color coded genes and exon segments. The data I will be utilzing involves the start and end locations of these segments.
I also need to include an additional track with statistical analysis plots for each gene that are aligned vertically.
I am lost as to how to start on this, which packages to use for my preferred output, etc. and would appreciate any help on this.
I have used ggbio (and in particular ggbio's tracks() function) before for something very similar this. It has some bugs but in general it works quite well!
Example:
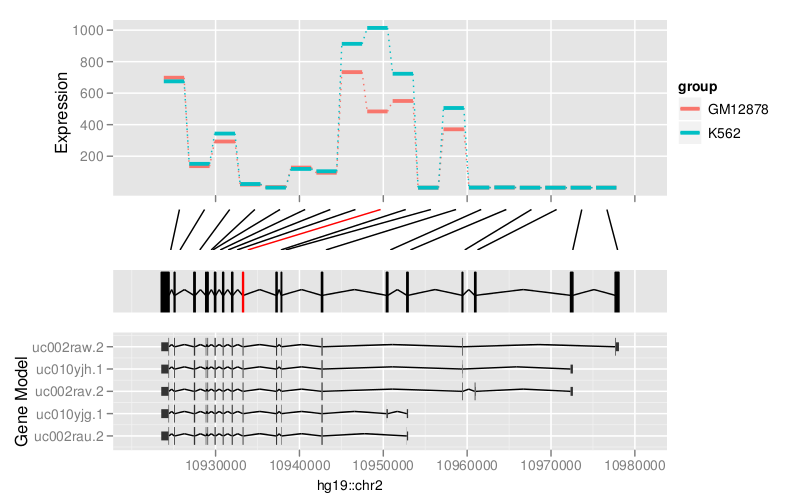
This may work out for me! Do you know if the graphic output I pasted above was developed with this package?
No, that graphic looks like it was made with some other tool. If you need to get something very close to the example you posted you could try drawing your own shapes using ggplot's geom_rect() and so on, but this would definitely be a bit more complicated.
Log in to answer this question.
This is a very specific request; you'll have to provide us with example data and a closely related example of what you want the output to look like (i.e. from another study or source as an example).
Tentatively though, I think this is the type of effort for which you might want to use a GUI-based program like Geneious (requires a license) or Galaxy (free).
Thank you for the quick response. The data is pretty simple, it involves the start and end sites for particular genes for yeast.
e.g.,
If that makes any sense. The output should look something along the lines of this (with an additional track) though I am unsure what package was used to create it. I apologize if I am unclear