
Thanks!
I'm basically doing the same as you. I have already annotated my clusters and I was re-checking the QC metrics and saw some cells with uncomfortably-low QC metrics, so I wanted to revamp the whole thing.
My biggest concern is that, the current data I am analyzing is a disease model whose tissue requires very strong dissociation (lots of low QC cells). However, it is also full of "diseased" cell types that we are interested in. Those diseased cell clusters have concerning QC values, but are expressing specific markers known in the literature. Thus, they aren't just poor quality/dying cells misclustered from a different cell type.
After having done a first pass of QC (+ ambient and doublet correction/removal), this is an example of the QC I have:

Cluster #3 (~700 cells) looks highly suspicious. High %mt and % unspliced + low nCounts suggests (as per this table ) damaged or dying cells. However, when looking at these cells in detail (see figure below), there isn't a clear correlation between %mt and %unspliced. This makes me doubt. Are these (more) damaged cells, or are these a population with both naturally high %mt and %unspliced reads? I'll have to check back to our tissue experts to see what do they know (and have previously validated) about these cells. They might have been deemed as senescent-like in the past? This study suggests that ribosomal protein synthesis is impaired in senescent cells, which would match these extremely low %ribo levels. And this other study suggests an increase in mitochondrial mass in senescent cells, which could lead to high %mt.
Other high % unspliced clusters like #14 and #17 have very low %mt and nCounts, so they don't match the description for "bare nucleus" cells.

When looking at some of these clusters in detail, I cannot see (at least as a first glance) clear trends pointing to one or another direction. Maybe #14 could be split into 2 groups, with one of them lower quality.
I annotated cluster both #17 and #18 as macrophages. Some studies have detected populations of silent vs activated macrophages, having different number of nCounts, although there is no information about the % unspliced reads. The low %ribo of #17 could also align with a silent state according to this study on ribosomal activation in immune cells
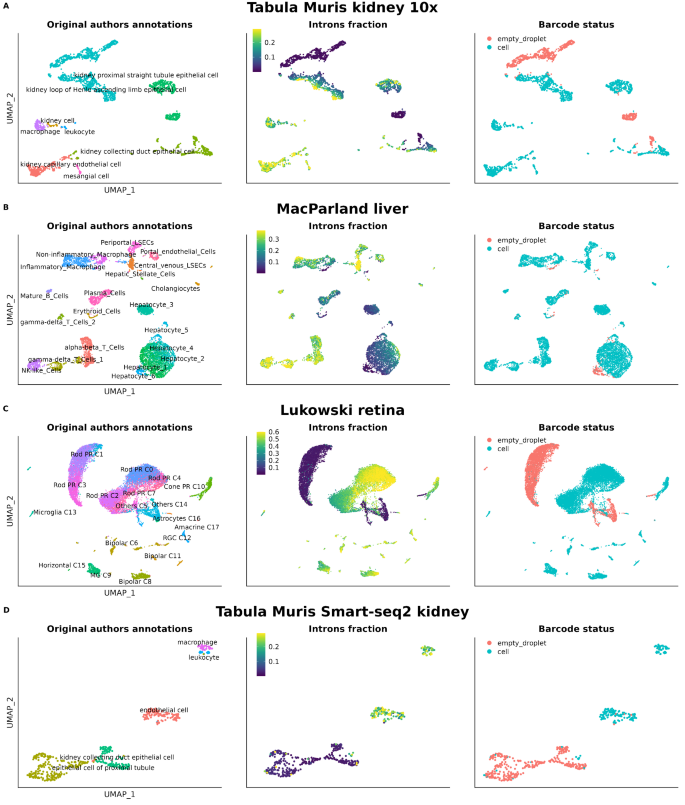
Is looking into % unspliced reads really useful, beyond an initial check for extremely low levels? (regardless Malat1 expression, all my cells have >1.5% unspliced reads). Or is focusing on this (and %mt or %ribo) just overanalyzing noisy data that leads nowhere?
I think I'll err on the side of using relatively lax cluster-specific QC thresholds. I'll limit my QC to "clean up outliers" in each cluster as much as possible. And then try to find biological explanations/justifications for those clusters with consistently altered metrics.
Thanks again for your insights.