How can I draw this plot?
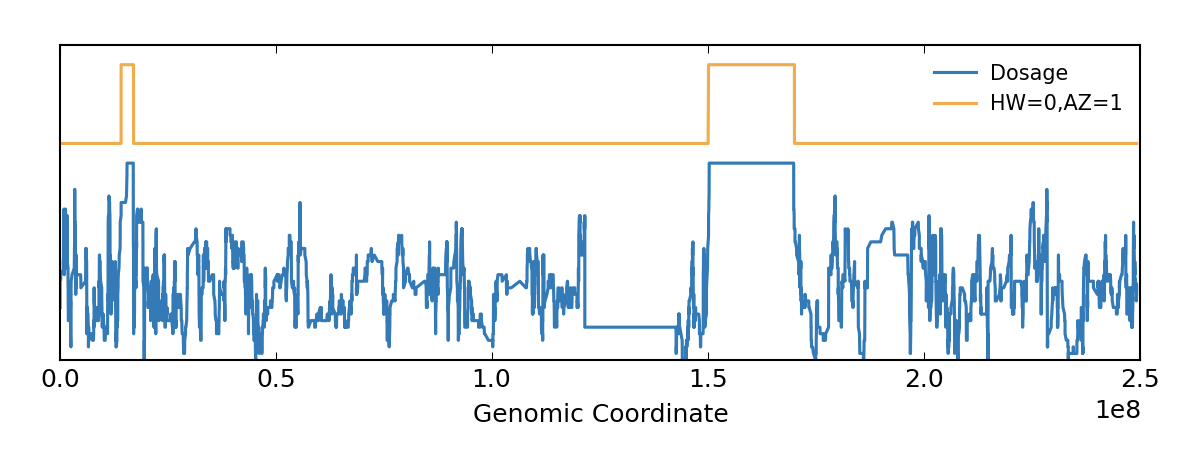
I used the following command on the vcf file to calculate roh. My question is how can I have this plot?
bcftools roh -G30 --AF-dflt 0.4 file.vcf
Source : https://samtools.github.io/bcftools/howtos/roh-calling.html
• 3,177 views
•
link
0 answers
No answers yet.
Log in to answer this question.
Hi mohammadhassanj,
I don't know exactly the format of the files produced by this command, but if you can use R, I'm pretty sure you can plot them using karyoploteR and maybe with the help of CopyNumberPlots to easily get the variant allele frequencies from the VCF. You can check the karyoploteR tutorial to find some more information and examples.
Hi bernatgel
thanks for reply
According to the command, a file is generated in above format in which the roh is estimated, but I do not know how to calculate "heterozygosity as dosag". Thank you
Heys, did you manage to plot it?
If you have found any tool to visualize it, then kindly let me know
Heys, what I did is to filter out the RG observations from the first column and then plot them along the genome with R. I did not manage to obtain this plot.
Hey, kindly help if you have found any tool to visualize it ?