
Hi all,
I am trying to understand why my peaks look to be noisy as compared to some references from ENCODE. Any thoughts from your side would be highly appreciated.
I have a group of treated (n = 7) vs untreated (n = 7) samples that were precipitated by H3K4me3 antibody and sequenced on an Illumina HiSeq machine. I used bowtie to map pair-end reads to the hg19 genome and using samtools I created .bam files. For peak calling I used MACS2 . To make bigwig files I used both deeptools and UCSC bedGraphToBigWig .
# macs2
# ___peak calling
macs2 callpeak -t sample1.bam  \
-c  input_sample1.bam input_sample3.bam input_sample7.bam \ #since there are no input per samples, all inputs included
 -f BAMPE \
-g hs --SPMR --keep-dup auto --outdir ./outputs -n sample1_macs2_call  \
-B -q 0.01 --trackline --nomodel  --extsize 147

#___ converting bdg to bigwig
macs2 bdgcmp -t sample1_treat_pileup.bdg \
-c sample1_control_lambda.bdg \
-m FE \
-o sample1_FE.bdg

#_ and
macs2 bdgcmp -t sample1_treat_pileup.bdg \
-c sample1_control_lambda.bdg \
-m logLR -p 0.00001 \
-o sample1_logLR.bdg

#_finally
sort -k1,1 -k2,2n sample1_FE.bdg > sample1_FE_sorted.bdg
sort -k1,1 -k2,2n sample1_logLR.bdg  > sample1_logLR_sorted.bdg
bedGraphToBigWig sample1_FE_sorted.bdg hg19.sizes sample1_FE.bw
bedGraphToBigWig sample1_logLR_sorted.bdg hg19.sizes sample1_logLR.bw

#___ making bigwig by deeptools

bamCoverage -b sample1.bam \
-o sample1.bw \
--binSize 20 \
--normalizeUsing BPM \
--smoothLength 60 \
--extendReads 150 \
--centerReads \
-p 12
Here is a screenshot from IGV to show how the peaks look like. For the sake of comparison, two samples one from ENCODE and another from GSE120339 were added. As you can see there are several peaks(noise?) in the first three tracks. I indicated some of them by the red arrows. Also regarding on-target peaks (here those overlapped with promoters) peaks in the first three tracks (my sample) are look different than the control track (last two tracks).
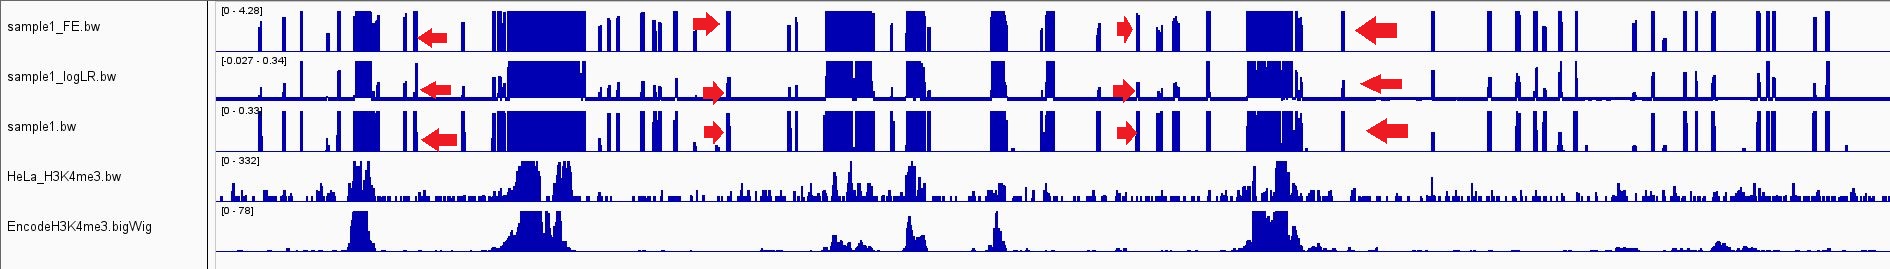
Check this link to see a bigger version of the image.
Please let me know if I am doing something wrong... Thanks
Koli

It might be helpful to auto scale each track so that the max height is set to the highest point in the signal. This would help to identify whether those peaks are "real" or not.
Thanks Jared, setting to auto-scale changed the peak appearance to look much better -especially on-target peaks- BUT some of those off-target peaks(noise?) remained unchanged and I can see them like vertical blue bars (as shown in the screenshot). I was thinking about some issues in upstream procedures like non-specific antibody binding. Do you think this kind of issue can lead to having those long vertical bars (peaks?/noise?).
Absolutely, ChIP can, depending on the antibody quality (specificity), the number of cells used for the experiment and the abundance of the protein target have a wide range of signal-to-noise ratio. This is why a good peak caller is key which takes into account an input (or IgG) control (if you have it) and/or the signal in the vicinity of candidate peaks. macs does that, see the paper for details on how that works (local lambda method). Unspecific binding can come from the background binding preference of the antibody, that is why people often include an IgG control, so an antibody without a specific target which simply binds unspecifically based on its isotype. You will often see spurious peaks in IgG that are somewhat similar to the actual ChIP sample (but much smaller) as ChIP peaks are often in open chromatin which are abundant in all kinds of proteins so like an "attractive" target for unspecific IgG binding. Also you can have just random DNA pieces that made it into the library prep, e.g. DNA that was sticking unspecifically to the beads one used for antibody pulldown. Lots of sources of noise in ChIP (or any (NGS) assay).
You can also utilize the ENCODE blacklist to ignore/remove regions that are known to be artifacts.