This is not an answer. Please add your comment to the above post and delete this answer. Thanks!
• 0 views
•
link
Hi Folks,
I am performing Hierarchical Clustering in R and wish to add two additional panes into the heatmap to indicate two things: 1. The subtype relating to the sample 2. An activity value which is scaled from 0-8
I have been looking into RowSideColors and I can manage to get the display I wish but instead of highlighting the subtypes it simply colors each sub Cluster! something along the lines of this (Image a) with the legend
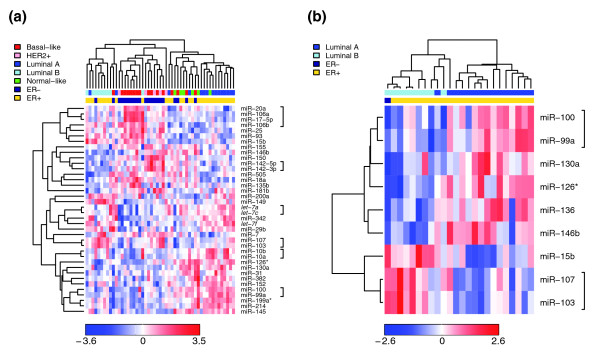
Have you read How Do I Draw A Heatmap In R With Both A Color Key And Multiple Color Side Bars? which describes how to add multiple color side bars. You can add any number of color side bars which highlight row/columns in any arbitrary way.
Log in to answer this question.
Have you seen How Do I Draw A Heatmap In R With Both A Color Key And Multiple Color Side Bars? post?