note: the figure in your paper deals with CNV's, not expression. That doesn't mitigate your point about modeling variability, just making sure people don't think that is an expression histogram.
Many experts claim that the negative binomial distribution is better than the Poisson distribution for modeling discrete RNA-Seq data.
Is this because
- The expression profiles of organisms resemble the negative binomial distribution - i.e.if I binned real gene transcription counts from an RNA-Seq experiment it would look like the plot below.
or
- The sampling error of gene expression is such that the true population mean of a gene looks like the negative binomial - i.e the true mean expression level of that gene is probably more (because of the skew) than the mean expression level of a sample of reads of that gene drawn from replicates.
or are these two concepts the same thing?

2 answers
Hi Jeremy.
It depends what you mean by "modeling discrete RNA-Seq data". If differential expression is your game, you need to keep in mind that we/others model the distribution of counts for a given gene across replicates; we don't model the distribution of an individual sample, as you suggest in your first point above. So for DE, we are not (explicitly) concerned with shape of the distribution of counts for the whole organism at all.
Assuming DE is your interest, the reason we choose NB over Poisson is that, in real biological applications, there is simply more variability than Poisson can explain. Poisson is a single parameter dist'n, with mean=variance. That assumption, which is really an approximation to the binomial, is suitable only for the variability associated with sampling the same DNA population (e.g. if you sequence multiple lanes of the same DNA, and assume no lane-specific effects, etc.). But if there is variation between your replicates (e.g. lab mice, people, etc.), the Poisson assumption will tend to underestimate the variance and any differences you observe (e.g. testing the null hypothesis that two groups have the same mean expression) will be overstated.
If DE is not your interest, then you'll have to explain what your end goals are (at least to me).
HTH, Mark (co-author of edgeR)
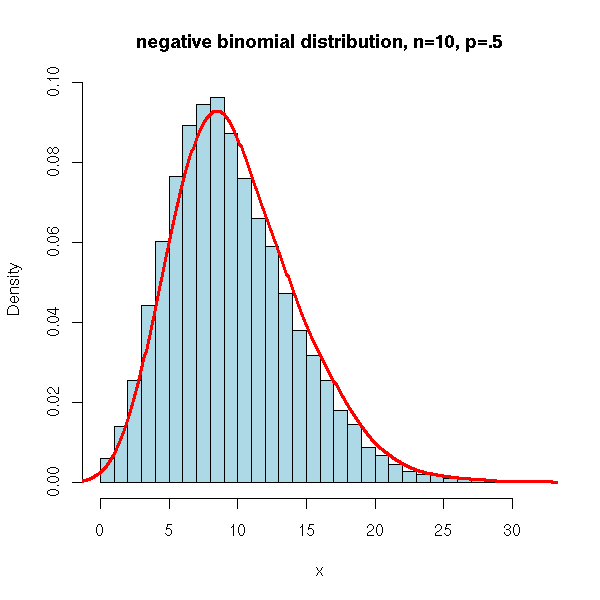
It's not about the skew of the distribution, it's about the variance. Take a look at the top two panels of this image (self link). The big difference is that the distribution based on a NB distribution can be shorter and fatter, or overdispersed.
The key to understanding the negative binomial distribution is that it's the same as taking lots of poisson distributions with slightly different means and adding them together. Essentially, this is saying that there's some sort of bias in the data causing this variability, but we aren't sure exactly what's causing it. The obvious candidates (GC content, mapability, sequence composition, etc) don't explain it all. Since it's difficult to correct for something when we don't know the source, we can do the next best thing, which is to model the distribution we see accurately. That's where NB distributions can overcome some of the limitations of poisson (namely that the variance/mean ratio is always equal to one).
Right. Sorry if that was confusing. The principle is the same, but the data is different.
the link was broken. Here is the link: http://journals.plos.org/plosone/article?id=10.1371/journal.pone.0016327 Look for figure 1.
Log in to answer this question.
Moved to separate question per suggestion
Please don't append questions to other questions, I think your questions would stand quite well on their own as a separate topic. Please ask a separate question.