T-Test In R On Microarray Data
3
1
Entering edit mode
11.4 years ago
Diana ▴ 910

Hello everyone,

I'm trying to do a simple t-test on my microarray sample in R. My sample looks like this:

gene_id        gene          sample_1        value_1     sample_2    value_2
XLOC_000001    LOC425783     Renal            20.8152     Heart       14.0945
XLOC_000002    GOLGB1          Renal            10.488     Heart        8.89434

So the t-test is between sample 1 and sample 2 and my code looks like this:

ttestfun = function(x) t.test(x[4], x[6])$p.value
p.value = apply(expression_data, 1, ttestfun)

It gives me the following error: Error in t.test.default(x[6], x[8]) : not enough 'x' observations In addition: Warning message: In mean.default(x) : argument is not numeric or logical: returning NA

What am I doing wrong? Please help.

Many thanks.

r microarray • 17k views
ADD COMMENT
8
Entering edit mode

Nag your supervisor to provide some more arrays and allow you to run the experiment again. The arguments to convince him or her are possibly that:

  • a nonreplicated experiment does not meet the standards of research in the field (does it in any field?)
  • the data will therefore not be publishable
  • the money and time invested in the first screen will therefore be wasted
ADD REPLY
3
Entering edit mode

+1 because I can't give +2 or more.

ADD REPLY
9
Entering edit mode
11.4 years ago

I think there's some misconceptions operating here from the original questioner. First and foremost, a t-test is not just a way of calculating p-values, it is a statistical test to determine whether two populations have varying means. The p-value that results from the test is a useful indicator for whether or not to support your null hypothesis (that the two populations have the same mean), but is not the purpose of the test.

In order to carry out a t-test between two populations, you need to know two things about those populations: 1) the mean of the observations and 2) the variance about that mean. The single value you have for each population could be a proxy for the mean (although it is a particularly bad one - see below), but there is no way that you can know the variance from only one observation. This is why replicates are required for microarray analysis, not a nice optional extra.

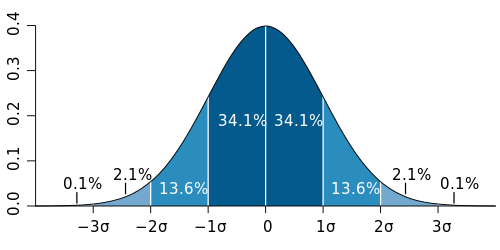
The reason a single observation on a single microarray is a bad proxy for the population mean is because you have no way of knowing whether the individual tested is typical for the population concerned. Assuming the expression of a given gene is normally distributed among your population (and this is an assumption that you have to make in order for the t-test to be a valid test anyway), your single individual could come from anywhere on the bell curve. Yes, it is most likely that the observation is somewhere near the mean (by definition, ~68% within 1 standard deviation, see the graph), but there is a significant chance that it could have come from either extreme.

Normal Distribution

Finally, I've read what you suggest about the hypergeometric test in relation to RNA-Seq data recently, but again the use of this test is based on a flawed assumption (that the variance of a gene between the 2 populations is equivalent to the population variance). Picking a random statistical test out of the bag, just because it is able to give you a p-value in your particular circumstance is almost universally bad practise. You need to be able to justify it in light of the assumptions you are making in order to apply the test.

BTW, your data does not look like it is in log2 scale (if it is, there's an ~32-fold difference between the renal and heart observations for the first gene above) - how have you got the data into R & normalised it?

ADD COMMENT
0
Entering edit mode

+1 excellent explaination for beginners

ADD REPLY
3
Entering edit mode
11.4 years ago

It looks like you are trying to do a t-test with one value per group. That is a statistical impossibility (hence, the "not enough 'x' observations" error). Your only real option is to calculate a fold-change between the two samples by calculating a ratio.

expression_data$ratio = expression_data[,3]-expression_data[,5]   # assumes log scaled data

You can choose 2-fold changed genes by:

expression_data_filtered = expression_data[abs(expression_data$ratio)>2,]

After you obtain replicates, you will want to use limma for gene expression analysis. Unmoderated t-tests are probably not the best way to go.

ADD COMMENT
0
Entering edit mode

Thank you so much Ben and Sean. Actually I'm trying to answer which of the genes are differentially expressed between these two samples and these are the only values I have. I don't have replicate experiments. Basically I want to associate some kind of significance to the differential expression and I thought calculating p-values would do that and hence the t-test. So there's no way I can calculate p-value for each gene with this data?

ADD REPLY
3
Entering edit mode

Hi, Diana. Unfortunately there is no way a statistical test can be performed without replication. The only option you have to compute p-values is to repeat the experiment.

ADD REPLY
0
Entering edit mode

Your interpretation is correct--no p-values with the data that you have in hand.

ADD REPLY
0
Entering edit mode

I don't know if this is a stupid question again, but someone whose working on such data suggested to me that a hypergeometric test can be done with only these values in hand. I wanted to confirm before I embarked on a useless journey. What do you all think?

ADD REPLY
0
Entering edit mode

How would you apply that test?

ADD REPLY
0
Entering edit mode

The hypergeometric distribution is used for the analysis of overlaps of gene sets, e.g. given 2 gene sets selected by some arbitrary choice, what is the probability that 100 or more out of the 1000 genes in each set are common to both both. That doesn't fit because you cannot make sensible gene sets yet.

ADD REPLY
0
Entering edit mode

Another point. The way you are approaching your problem is detrimental to the solution. Instead of responding by picking some random methods which you seemingly don't understand, you should: - respond to our proposal to replicate the experiment (what did your boss say about replication?) - try to understand how tests work

ADD REPLY
0
Entering edit mode

Thanks. No replicates for now. Maybe in near future.

ADD REPLY
2
Entering edit mode
11.4 years ago
Ben ★ 2.0k

You are applying the t-test to the 4th and 6th value in each row; firstly R doesn't use zero-indexing so you don't seem to have a 6th column and secondly you are comparing two single values each time.

For an (unpaired) t-test comparing expression_data$value_1 and expression_data$value_2 try:

t.test(expression_data[,3], expression_data[,5])$p.value

edit: of course it's probably more useful to keep the whole returned list than just the p-value

ADD COMMENT
0
Entering edit mode

Thanks a lot. I want to put all pairwise p-values in one object. When I try to use a loop, it gives me the same error again.

for(i in 1:38620)
{
u = t.test(expression_data[i,3], expression_data[i,5])
}

Error in t.test.default(RNA[i, 3], RNA[i, 5]) : not enough 'x' observations

What's wrong with my loop?

ADD REPLY
3
Entering edit mode

Again, you're trying to perform a t-test on two values... I think you need to look at what a t-test is and think about what you're trying to find from this data. You likely just want to add paired=T to the code I gave you above. See ?t.test in R too.

ADD REPLY
0
Entering edit mode

I need to do a t-test for each gene and I will be using two values for comparison. My question is: how can I do the pairwise t-test for each of the two values quickly...I was thinking a loop but its giving me an error. I don't want to do a t-test for each gene individually because I have a lot of genes

ADD REPLY
0
Entering edit mode

As Ben and I point out, you cannot perform a t-test between groups with only 1 member in them. As an aside, using a for-loop like this in R is usually not the best way to go. See the "apply" function for a better approach (can be orders-of-magnitude faster than a for loop).

ADD REPLY

Login before adding your answer.

Traffic: 2707 users visited in the last hour
Help About
FAQ
Access RSS
API
Stats

Use of this site constitutes acceptance of our User Agreement and Privacy Policy.

Powered by the version 2.3.6