R-Plot-Snps-Sliding Window Or Circular Plot
I have VCF file with 20K SNPs predicted over 20K contigs. I have calculated SNPs, heterozygous, homozygous from VCF file
From VCF file, I have created file which as
Contig length  No.of SNPs  No.of het  No.of Homo
     500               23            3        0
     800            12            0        1
    1037            223           5        0
   33876            26            0        2
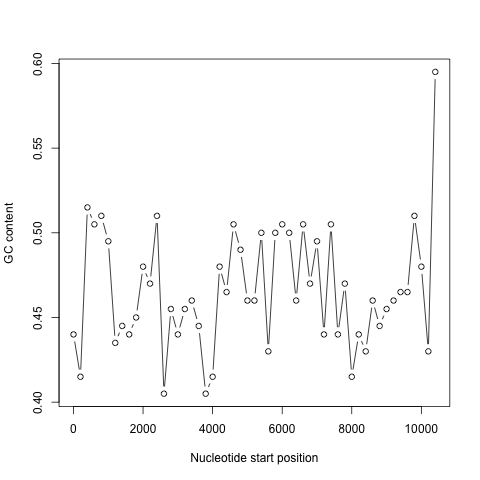
I would like to plot SNPs over contigs either in sliding window or circular visualization or any other easy visualization plot. Did anybody did plotting SNPs for contigs, please share or recommend your good visualization plot. Below shown some example of plot.

• 10,051 views
•
link
1 answer
Both comments are spot on. Circos and R are some of your best options. For a genomic sliding window in [R] you could use my C function.
• 2 views
•
link
Log in to answer this question.
Off topic comment: How about Circos?
I would like to do in R package. I never tried circos. Did it support VCF format?
Circos uses its own format for data, which is tightly tied to its presentation. You would need to write a script to convert the VCF file to the format the Circos understands, along with presentation settings for subcategories of your input data.