
Hi, everyone,
Recently, I've learned the software clusterProfiler and made some relevant analysis and summary. Now, I'm going to share it with you.
As is known to all, DNA and RNA sequencing have gradually become widely used techniques in molecular biology research. Among them, RNA sequencing (RNA-seq) especially anchors itself on the basis of determining phenotypic variation. The phenotypic variation ranges from the population level under certain biological characteristics/conditions to the disease pathology of a person or group of people.
However, before starting an RNA-seq project, there are some fundamental questions helping to reveal and understand the molecular mechanisms of gene expression in various biological processes:
- How to analyze the huge and complicated sequencing data into meaningful and obvious results?
- How to select genes related to the phenotype of related organisms and relevant biological phenotypes, and find the biological pathways of significant differentiation?
- How to quantify the expressed genes and further analyze the important candidate genes?
The analysis of RNA sequencing data usually starts with the identification of genes that are responsive to specific conditions or that have undergone experimental treatment, and show significant phenotypic variation between biological groups. Then, the sequencing reads are quantified and the process of variation in the transcriptome profile is estimated. There are several online and desktop tools (R and python packages) for differential expression analysis of aligned RNA-seq data. In the next step, the transcripts will be further refined and annotated through gene families and functions. The main purpose of this is to determine a group of genes belonging to a certain functional group, which will help us prove the phenotypic differences between the samples or groups. The tools for functional analysis of differentially expressed genes involve a variety of methods, and can be divided into three categories: ORA (Over-Representation Analysis), FCS (Functional Class Scoring) and PT (Pathology Topology).
ORA is the discovery of an over-represented gene or protein in a set of genes or proteins, which is currently the most common enrichment analysis. The most commonly used statistical tests are the hypergeometric test and the chi-square test. However, the shortcomings are also obvious, such as ignoring genes that are not significantly different and ignoring the mutual influence of genes. Considering the attribute information of gene expression value, compared with ORA, FCS has an obvious breakthrough in theory. The representative of FCS method is Gene Set Enrichment Analysis (GSEA). The principles of PT and FCS are similar, but the path topology method is used in the statistical test of genetic level, which is tightly dependent on the accuracy of accessing the database and is not very mature yet. There are many softwares for gene enrichment analysis. But today let's talk about one of the most common used, clusterProfiler.
What is "clusterProfiler"?
"clusterProfiler" is an R package that provides statistical tests for expression analysis of terms such as GO (Gene Ontology), which are related to gene lists that have shown statistically significant differences. When using this tool for GO analysis, only two inputs are required: a list of genes that show significant differentiation in expression and a list of background genes. Hypergeometric tests are used for statistical enrichment analysis test. The basic point of the package allows to select GO terms measuring BP (biological process), CC (cell component), MF (molecular function) to test.
The package supports the following types of analysis:
- Over-Representation Analysis: This is a statistical method used to determine whether there are more genes in a pre-defined set of genes (for example, genes belonging to a specific GO term or KEGG pathway) than expected (over-represented) genes in a subset of your data.
- Gene Set Enrichment Analysis: GSEA, also known as functional enrichment analysis, is a method used to identify genes or proteins that are over-represented in a large number, and there may be an associated relationship to disease phenotypes. GSEA performs as a the powerful analytical method for interpreting gene expression data. This method obtains its functions by focusing on gene sets (for example, genomes that share common biological functions, chromosomal location, or regulation).
- Biological Theme Comparison: After enriching and classifying the significantly expressed genes in several gene clusters, researchers may have further interest in identifying and comparing biological themes in gene clusters.
The R package is available on Bioconductor (https://bioconductor.org/packages/release/bioc/html/clusterProfiler.html). And it implements methods to analyze and visualize functional profiles (GO and KEGG) of gene and gene clusters. The package can take input data from different sources (MicroArray, RNA-seq). After differential analysis, enrichment analysis (ORA: GO enrichment, KEGG enrichment, and FCS: GSEA enrichment) can be performed using the packages and displayed visually.
How to use clusterProfiler?
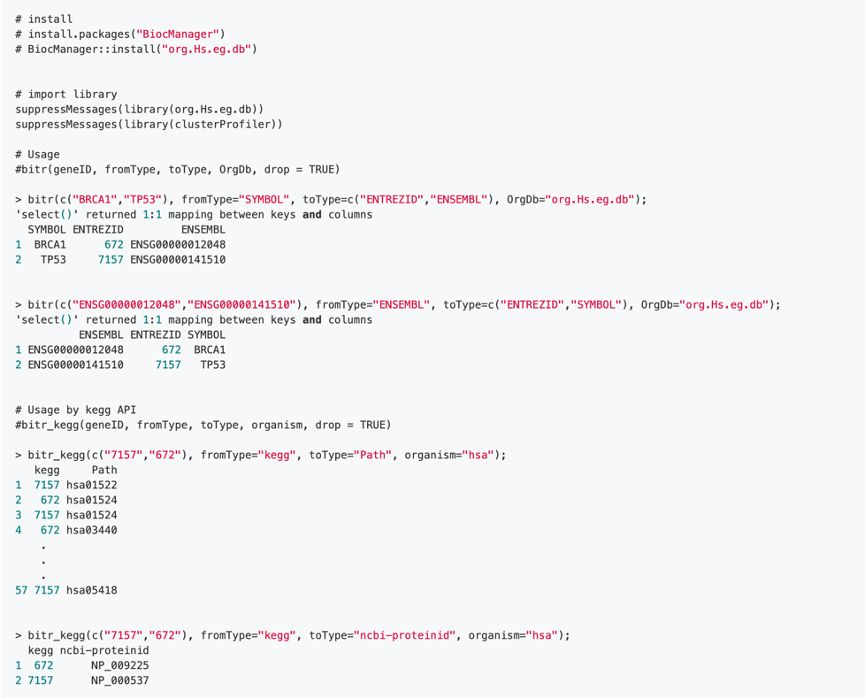
1. ID conversion
For common model species, ID conversion can be achieved by the OrgDb annotation package in Bioconductor. It shows successful experience in more than 20 different species till now, such as humans, mice, fruit flies, zebrafish, etc.. and for uncommon species or non-model species, AnnotationHub can be used instead.
Steps can be:
2. GO/KEGG/GSEA Enrichment analysis
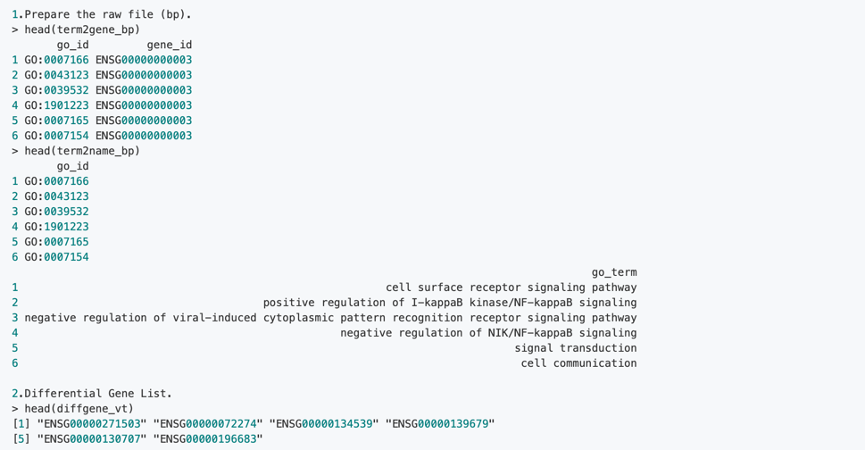
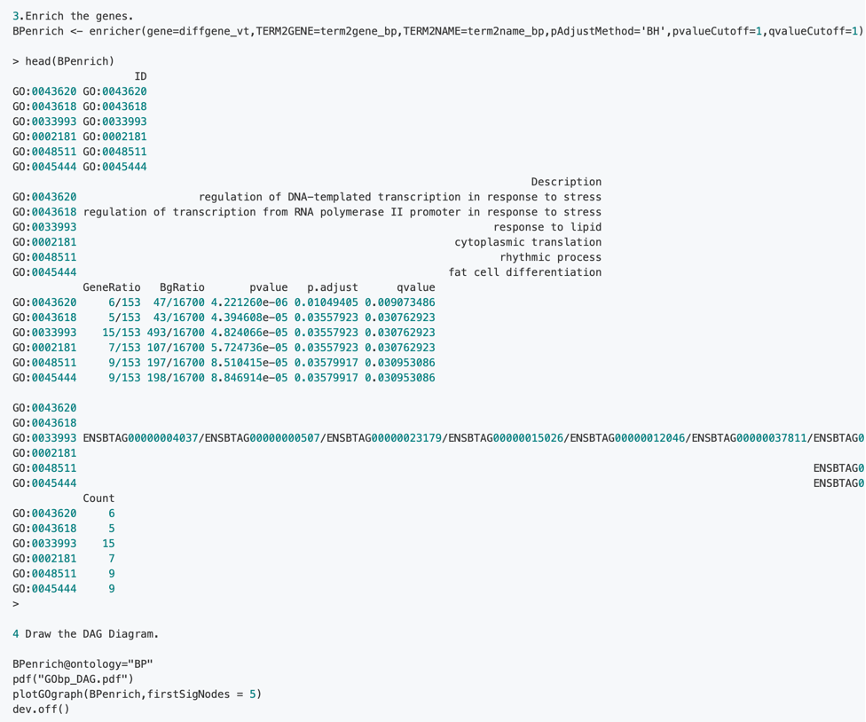
2.1 Step of GO analysis:
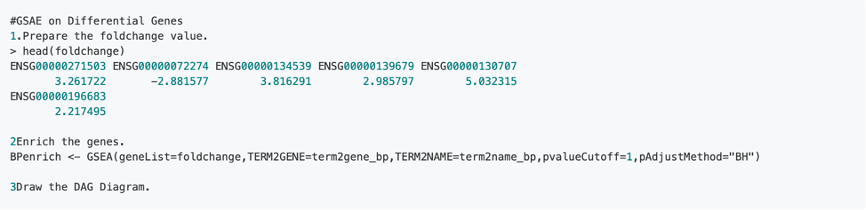
2.2 Steps of GSEA enrichment on GO Analysis:
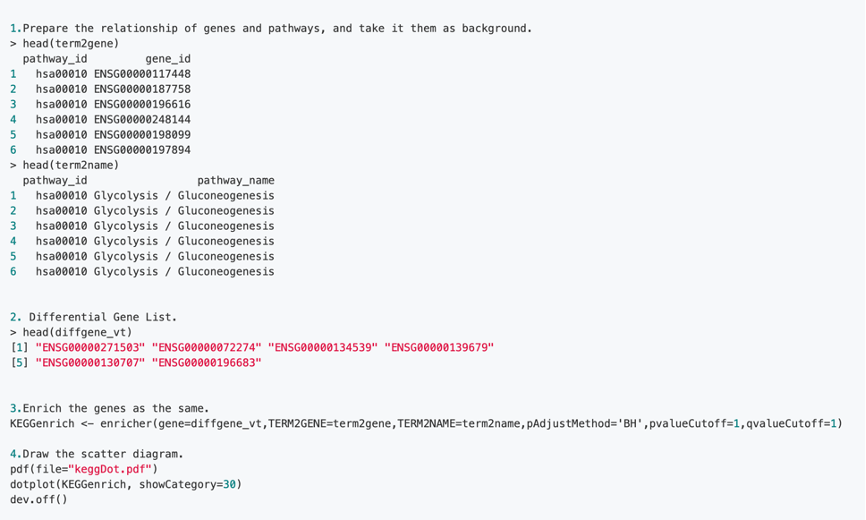
2.3 Steps of KEGG Analysis
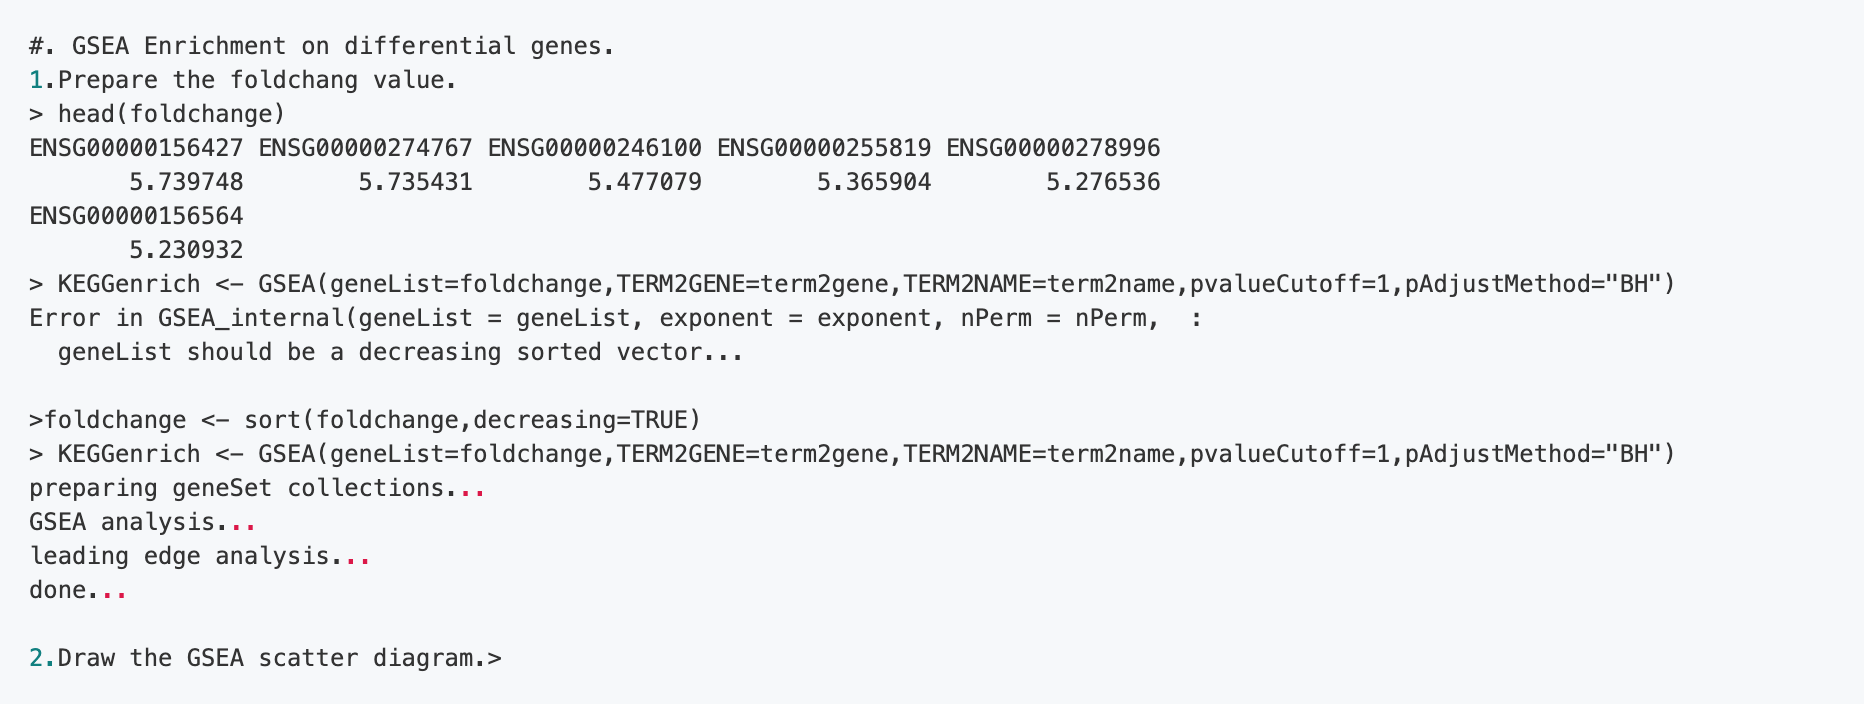
2.4 Steps of GSEA enrichment on KEGG Analysis
Seeing this, do you know how to use clusterProfiler to analyse your data? Let's take out the data and begin to practice! If you have any questions or comments, just leave them here so that we could make progress together.

thanks for sharing. It's really clear for me, a fresh man. Would it be possible if you can show some figures as reference for me? thank you!
and now there is a new paper for clusterProfiler, https://www.sciencedirect.com/science/article/pii/S2666675821000667.