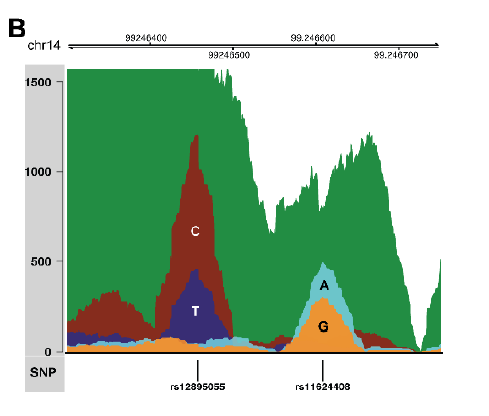
how to make this plot with Gviz
ATAC-seq reads pile-up showing allelic bias at SNP sites rs12895055 and another linked SNP rs11624408
snp
r
gviz
sequence
• 1,068 views
•
link
updated
by
ATpoint
9.1K
• |
written
by
g744695539
0
0 answers
No answers yet.
Log in to answer this question.
More posts like this
-
Weird behaviour - WGCNA hub analysis results in Cytoscape through CytoHubba plugin change every tim…
written by Raito92 10Hello everyone, I'm using Cytoscape v. 3.9.1 to visualize the results of a previously perfmored WGCNA analysis. The aim is to individuate hub genes through …
-
how to understand rgt-hint differential result
written by zq 0i am analysing an atac-seq data, when I run rgt-hint differential, I got the result successfully, but i have confuse about the result for my …
-
how to make this plot with Gviz
written by g744695539 0![ATAC-seq reads pile-up showing allelic bias at SNP sites rs12895055 and another linked SNP rs11624408][1] [1]: https://ibb.co/3N57Mhh
-
Single-cell RNA-seq coverage track not corresponding to gene structure
written by Eugene A 19Hi, may be comeone can clarify the following things: I have a 10x data, which I processed through the cellranger pipeline counting and aggregating samples. …
-
FASTQC per base sequence quality plot
written by pancakeplant 1Hi all, I have a set of fastqc outputs and I was wondering whether the per base sequence quality plots look fine. These are the …
-
Tool: CellKb 2.0: A database of cell type marker gene sets
written by Ashwini Patil 2**[CellKb][1] - a database of cell type markers** ---------------------------------------- CellKb is a knowledgebase of cell type marker gene sets **manually collected** from scientific literature and …
-
fastqc of chipseq dataset - two peaks in GC content
written by Assa Yeroslaviz 197We are running a ChIP-Seq experiment of multiple samples on one flow cell. when looking at the fastqc results of the samples, they all look …
-
Why tumor samples of a same TCGA donor get different VAF via WGS and ATAC seq?
written by solo7773 9This question arose when I read the following science paper *The chromatin accessibility landscape of primary human cancers, 10.1126/science.aav1898* As shown in the figure below …
-
High A in "Per base sequence content" of fastQC report
written by DVA 64In my RNA sequencing fastqc report, I consistently notice an abnormally high A (green) peak in session "Per base sequence content". See images below. I …
-
RNA-Seq Genome mapping visualization?
written by qingxiangg 4![enter image description here][1] [1]: https://i.imgsafe.org/622e330.png Hi, I wonder what software or R package can visualised RNA-seq reads:Genome mapping dataset like this image?