Question: R: Manhattan Plot of LRT Values Instead Of -Log10(p)
Hi all!
Do you know how to make a manhattan plot of LRT values instead of -log10(p) for regional heritability mapping analysis?
The results file consists of the following columns:
CHR SNP BP LRT
Many thanks!
• 2,268 views
•
link
1 answer
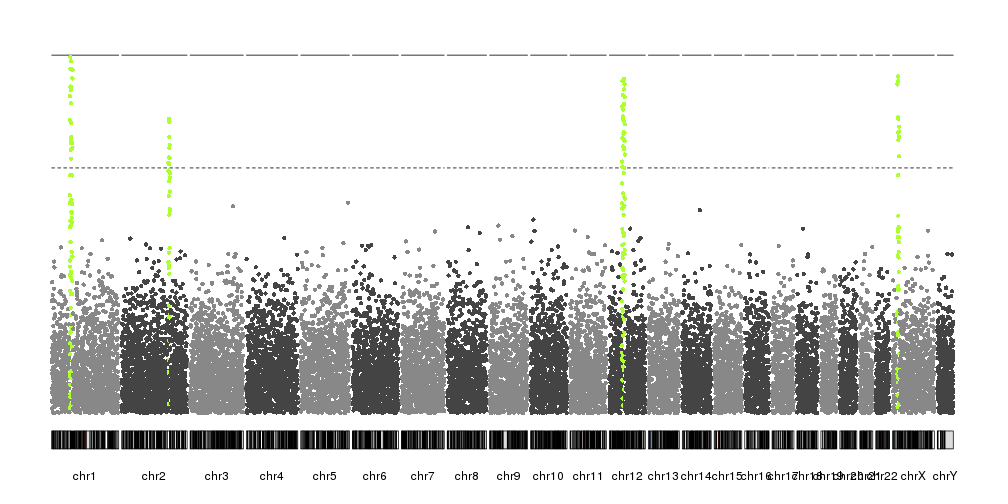
Hi, you might want to take a look at kpPlotManhattan from karyoploteR. With it you can create a manhattan plot with correct x coordinates and can plot any values you want. By default it will transform the values with -log10 but you can disable with with "logp=FALSE".
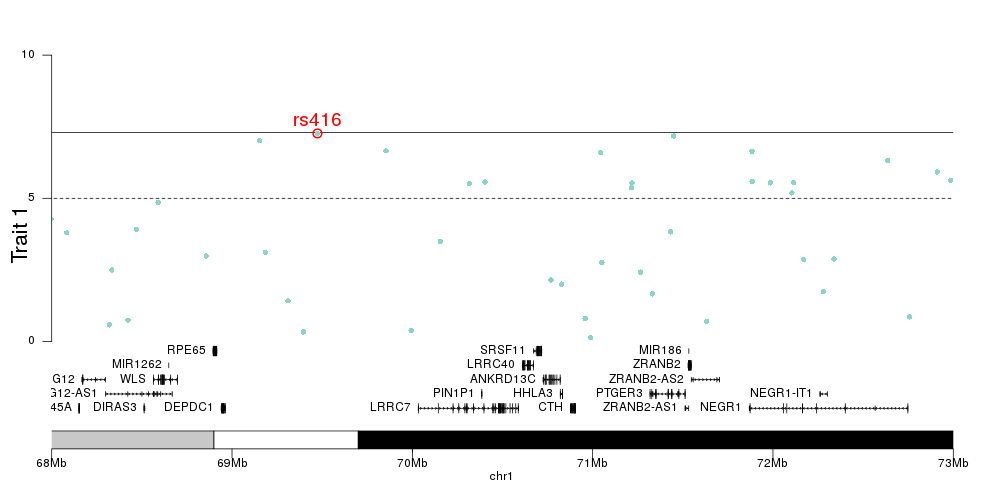
If you need it, you can also create zoomed plots of smaller regions (peaks, for example) and add other data such as genes or virtually anything else.
• 0 views
•
link
Log in to answer this question.
I'm guessing the answers here are highly relevant to your case.