Plot per base coverage from regions coverage with R
Hi!
I have a dataframe with some oligonucleotides coverage inside genomic region: the first column indicates its genomic coordinates and the second indicates its coverage.
12:36761802-36761804 54

12:36761802-36761805 42

12:36761802-36761806 56.5

12:36761802-36761810 28.75

12:36761803-36761804 29

12:36761803-36761806 30
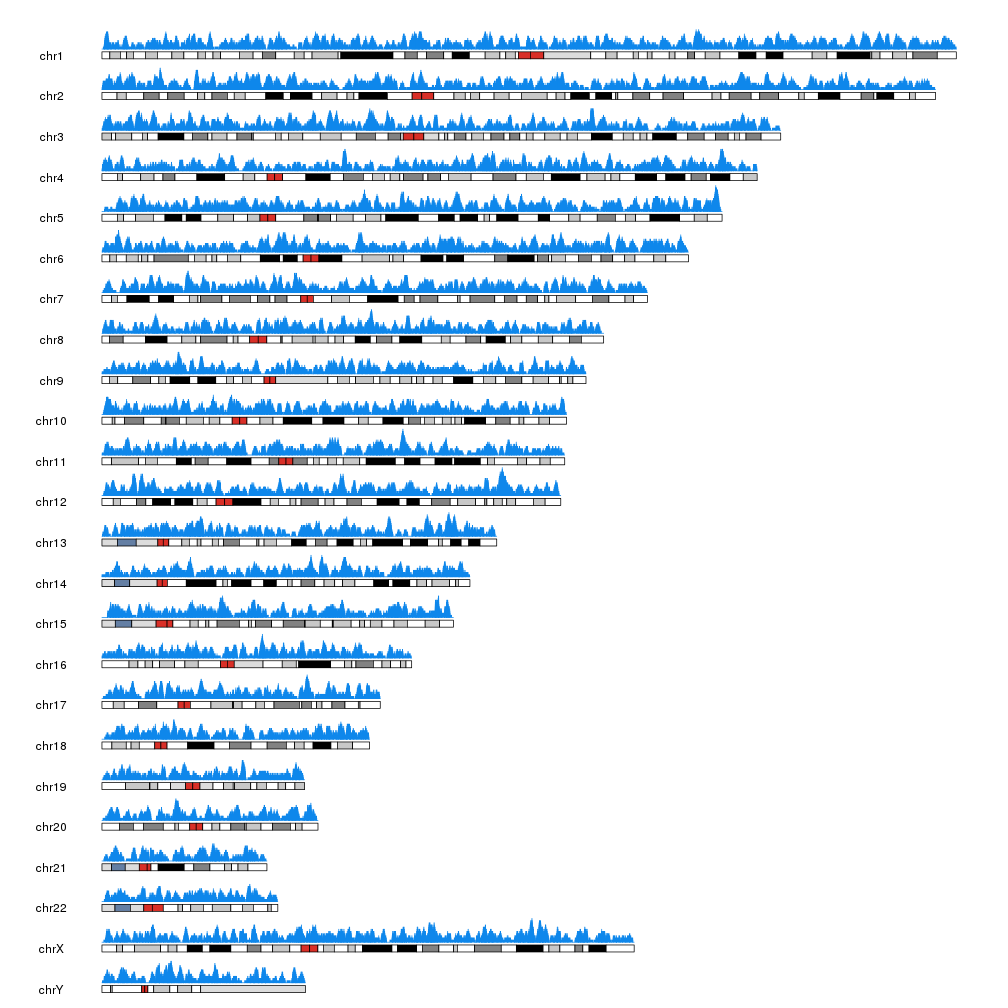
How could I generate a per-base coverage plot? As you can see, this regions are overlapping, so I would like to know how can I get a plot with genomic position in the x axis and coverage in the y axis.
Thanks
• 1,345 views
•
link
1 answer
You can use karyoploteR to achieve something like this
• 0 views
•
link
Log in to answer this question.