I am looking for a way to identify similarities between different ChIP-Seq data sets.
Is there a tool or an R package to calculate and/or plot correlations between different bedgraph (or bigWig) files from different ChIP-Seq runs (done with macs2) or homer.
thanks
1 answer
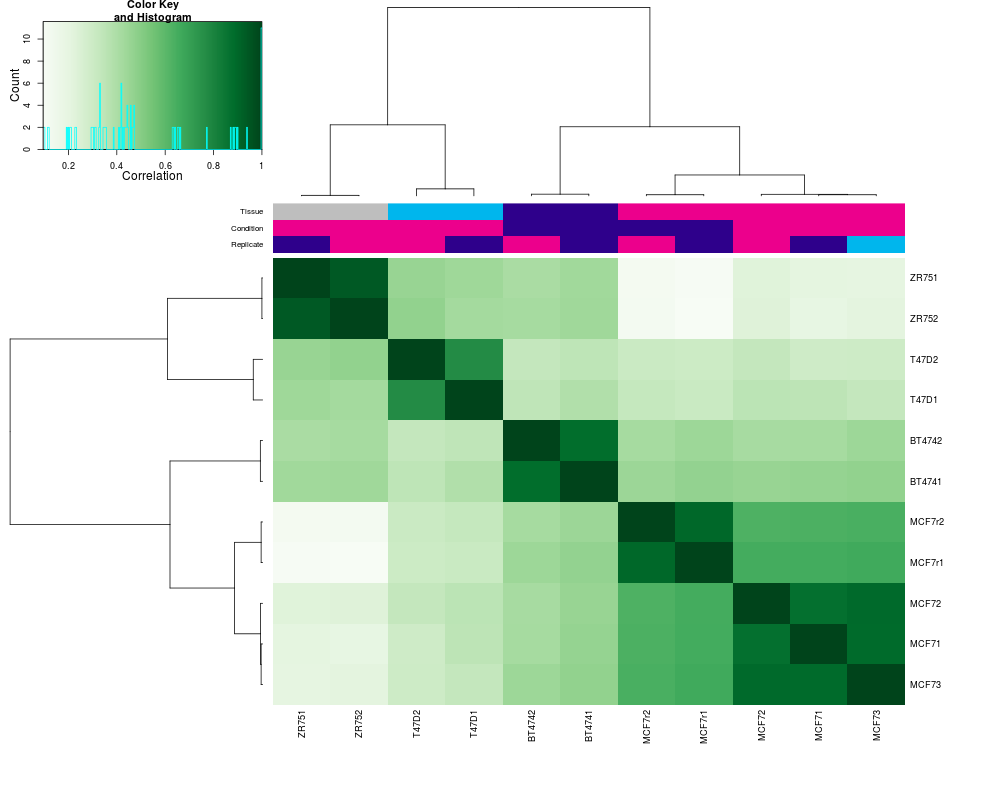
The DiffBind package in Bioconductor will calculate correlation values and plot clustered correlation heatmaps (as well as PCA plots, which are are useful to assess similarity amongst ChIP-seq samples).
This works by looking at all the peaks (called by MACS2 in your case), forming a consensus set (default includes peaks overlapping in at least two samples), and calculating correlation values. You can get a more accurate view by also supplying the aligned reads (bam files) and re-counting the number of reads overlapping each condensus peak site in each sample (regardless of whether it was called as a peak in that sample).
Log in to answer this question.
If you want to test if the peaks are at the same regions, you can maybe try with regioneR. It won't test anything related to the shape of the peaks, though.
Also StereoGene to find correlations among many types of genomic feature data
I would suggest deeptools