Isoform level TCGA RNA-seq Expression data
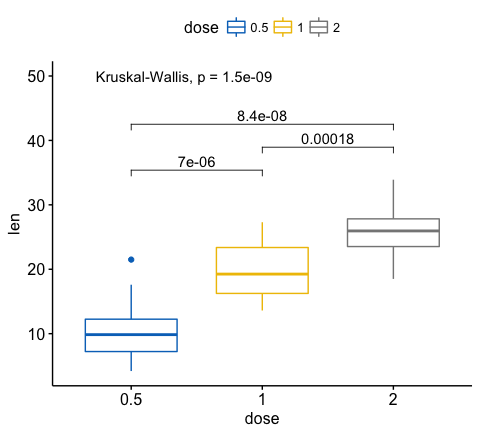
I have Isoform level RNA-seq data from The Cancer Genome Atlas and I want to check the difference the difference in the level of a particular isoform between cancer and normal samples. Is there any software or R package which I can use to plot a boxplot showing difference in that isoform between normal and cancer sample with p-value?
• 2,338 views
•
link
1 answer
Log in to answer this question.
If I may ask, how did you obtain Isoform level RNA-seq data from TCGA? I am trying to do so via TCGAbiolinks R package, however, without positive results