How to remove outliers using PCA in R?
Hi,
I detected several outliers among my samples by plotting PCA. But I don't know how to remove this samples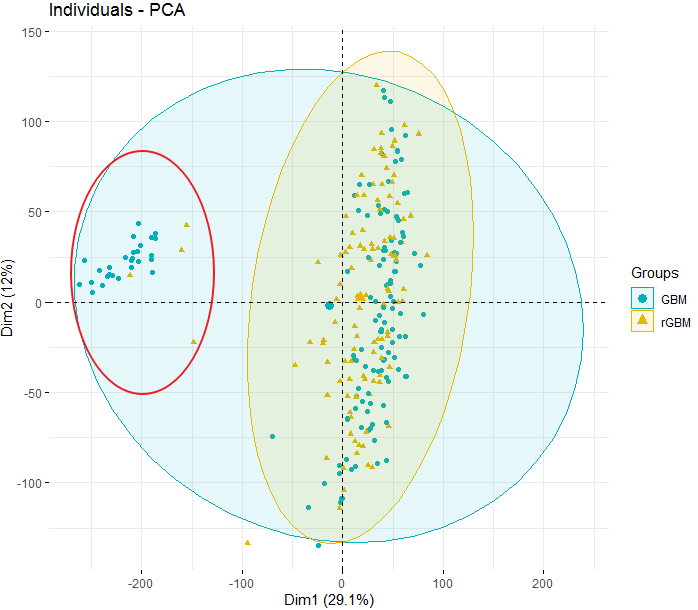 The outlier samples is marked by the red circle.
Thanks
pca
r
• 11,313 views
•
link
written
by
zhaoliang0302
5
0 answers
No answers yet.
Log in to answer this question.
More posts like this
-
Inferring input data suitability (quality and quantity) from PCA for machine learning classificatio…
written by Shakunthala Natarajan 2I am tackling a multi-class classification problem. I have 8 classes (tissue types - Class A to H in the plot shown) for classification. I …
-
How to deal with outliers after heterogeneity test in microarray expression datasets?
written by Aditi 0I have performed a meta-analysis using five micro-array datasets. After performing meta analysis I visualized the heterogeneity using funnel plot and forest plot (using two …
-
About outliers and non -separated samples in PCA
written by Zahra 11Hi all, I have plotted PCA for my samples(Tumor and Normal) in some cancer types. I have used the HTSeq-counts data from TCGA. Then I've …
-
How can I identify and remove outliers samples based on a MDS plot (limma package)?
written by andresllucena 4Hi, I downloaded microRNA expression data from TCGA (Isoform Expression Quantification files) using the TCGAbiolinks package from Bioconductor. Now I made a MDS plot using …
-
Detecting Outliers by looking at PCA
written by leekun4 1Hi, I performed the PCA analysis to see if there's any outliers in my analysis. [Here's the PCA plot][1] Is it safe to assume that …
-
Plotting Bar charts in R
written by michele.tebaldi.92 4Hi everyone, I'm new to R plotting functionalities. I'm trying to plot an horizontal stacked bar plot divided in three groups based on my table. …
-
RNA-seq replicates not clustering
written by sckinta 74I know someone posted similar topics before (https://www.biostars.org/p/315214/ ). However, here, I want to prompt some discussions on this topic with given plots and examples …
-
PCA plot interpretation
written by phur 0Hi Everybody, I have analyzed some RNA-Seq datasets using Deseq2. I have five samples of the Normal embryo and three samples of Trisomy 21. I …
-
Statistical approach to identifying outliers in RNAseq data?
written by Lina F 20Hi All, I am looking at a larger RNAseq dataset (144 samples) and I did some exploratory data analysis to look at clustering. From the …
-
Outliers in microarray dataset - Possible explanation?
written by User43533445 1Dear all, I am new to microarray analysis and I have a question regarding some of my samples. I have 192 samples collected from 15 …
You should explain how you generated your PCA plot (from which type of data ? ). Put your code. And a minimal reproducible example.
The data is a dataframe of RNAseq FPKM expression file, rows correspond to genes and columns to samples.
My first question with such a plot is, what are these outlier samples? Is there a biological or technical explanation for this?
I downloaded this RNAseq data and just explore it. Considering the large samples, I think remove these 'outlier' samples is not a risk.
Are all samples from the same dataset ? Do you have metadata on this samples (sequencing kit ? type ? cell type ? sequencing plateform, etc...) IMO you see here a clear (non-biological) batch effect
Yes, all tumor samples are from the same dataset. The clinical data doesn't contains batch information. So I want to remove these samples directly.
I guess in the
pcaobject you should havePC1andPC2(information used to plot). Use these to filter out the samples i.e.PC1 < -100Thanks, I save this plot as PDF file (large size) and then zoom in to get the outlier samples. It sounds silly but it really works :-)
Hi, I am also facing the same issue, and by checking your suggested method I am finding the actual sample which have pc1 < -100 are outlier. Please can you share explanation what is the basis of the threshold selection of -100. It would be much helpful. Thank you.
ues fviz_pca_ind(pca_all, geom.ind = "text") to show sample names on the plot.