Entering edit mode

4.9 years ago
arronar
▴
280
Hello.
I've create a plot of a hierarchical clustering that looks like the following.
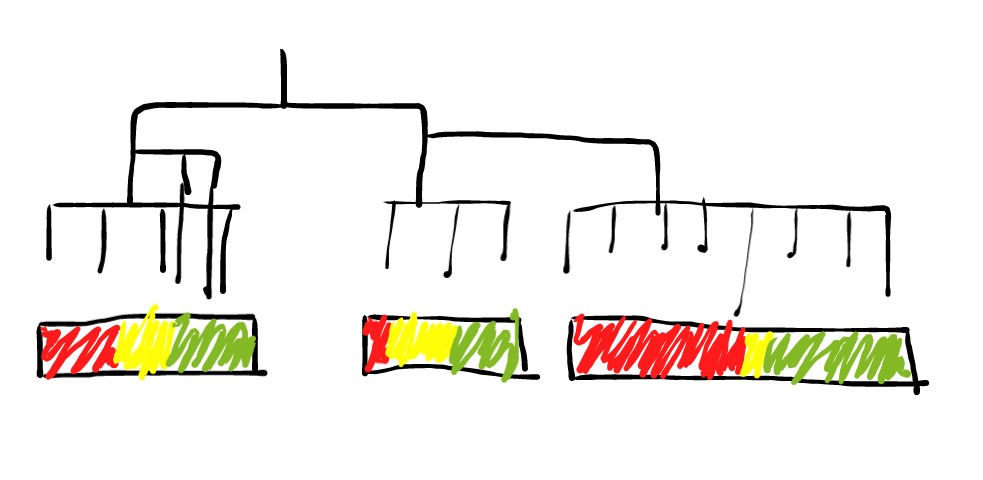
As you can see there are three clusters created. So what I want to do further on, is to take the elements of each cluster and create a stack bar for each one by using a meta variable (tissue) that describes from which tissue each element is coming from.
Such a plot is depicted above in my sketch. For example for the first cluster red color represents the nervous system, the yellow one the blood and the green the skin.
So I was wondering if there is any R package that can help me create something like that , or if I have to build the stack bars separately and the paste them under the tree.
Any hint/ idea is welcome.
You can likely achieve what you want with ComplexHeatmap, in particular this section of the vignette: Chapter 3 Heatmap Annotations.
Otherwise, it should be fairly easy to build the plot components manually, and then position them either manually or via the use of
par(mfrow)andpar(mar)Maybe consider colouring labels instead of bars to show groups. See dendextend package for example. There many other packages that allow label colouring.