The sample was already processed with trimmomatic, including adapter removal.
FastQC did not detect adapters.
The quality Phred score was above 28 for all bases.
• 1 views
•
link
Hello!
The following graph shows a fastq file (WGS) after trimming (sample comes from mouse). Adapters and low quality bases were removed with trimmomatic. The module "Overrepresented sequences" was flagged with a "PASS".
I have gone through other threads. This one in particular help me link1, but I am not sure what it means when a curve has "Small shoulders".
This other thread Link2 also gives useful hints, but again the meaning of "a broad secondary peak" can be ambiguous.
Based on the figure below, could you help me decide if the sample is acceptable for downstream analyses, and if I should apply some other tool to correct this issue?
EDIT: links fixed and sample nature added.
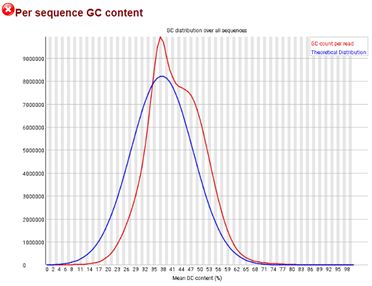
Shoulders in this graphics are usually compatible with at least two issues
Presence of contaminant DNA
Poor quality in the sequencing
The point2 can be solved at least in part after a quality trimming. If the shoulder persist after the quality trimming a contamination fo your samples can be likely to be happening. A rapid metagenomic analysis with programs like Kramer can maybe help you in getting an answer
The sample was already processed with trimmomatic, including adapter removal.
FastQC did not detect adapters.
The quality Phred score was above 28 for all bases.
Log in to answer this question.
What is the nature of the sample? That is, is it RNA-seq, ChIP-seq, etc.?
I added that to the post. It is WGS data
A bit of PCR bias could produce this. As others have mentioned, you might as well continue the analysis.
Your two links are the same one.
I don't see a second peak on your graph (at least not a clear one). The parabol is not perfect but I would personally not worry about this for the next step
You work on mouse, if you got human contaminations, reads from human will not map the mouse reference genome and will stay unmapped