Heatmap with normalised count from DESEQ2
I was wondering which is better (or if one of this method is wrong ) for plotting in a heatmap normalised count from deseq2 :
counts(dds,normalized=TRUE) :
z-score( log2(norm count +1) ), z-score(norm count ) or just log2(norm count +1)
• 8,341 views
•
link
1 answer
I've used scale() with scale=TRUE, center=TRUE on rlog-normalized, which is a bit like z-score. I've seen people also plot log-scaled expression values too.
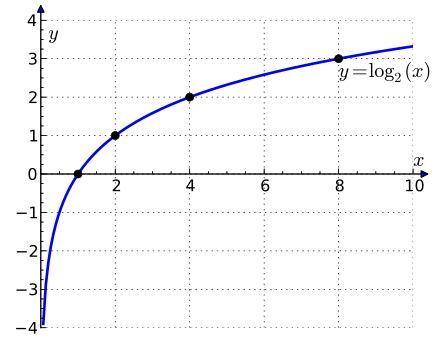
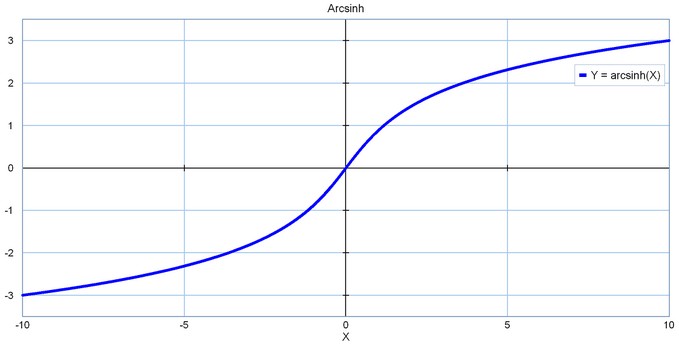
One tip - if you use asinh() instead of log2(), you can create the same kind of scaling, but you don't have to add 1 in order to account for possible cells that equal 0. For comparison:
• 1 views
•
link
Log in to answer this question.
Take a look at how they are used in the DESeq2 vignette: Heatmap of the count matrix.
Normalised [unlogged; untransformed] counts are used for QC purposes and are neither logged nor Z-scaled. In addition, the default passed to pheatmap is
scale="none".For downstream analyses, you should really be using the regularised log or variance stabilised counts, and you can Z-scale these, if you wish. You do not have to log these.
Elsewhere, from EdgeR, people use logged CPM-normalised counts for heatmaps. For other tools that derive values in FPKM, people usually log those too (they can also be Z-scaled via the zFPKM function). You'll never see me use FPKM data, though.