Thank you so much for your detailed answer! I'll address different parts of your post in unique comments to keep the threads separate.
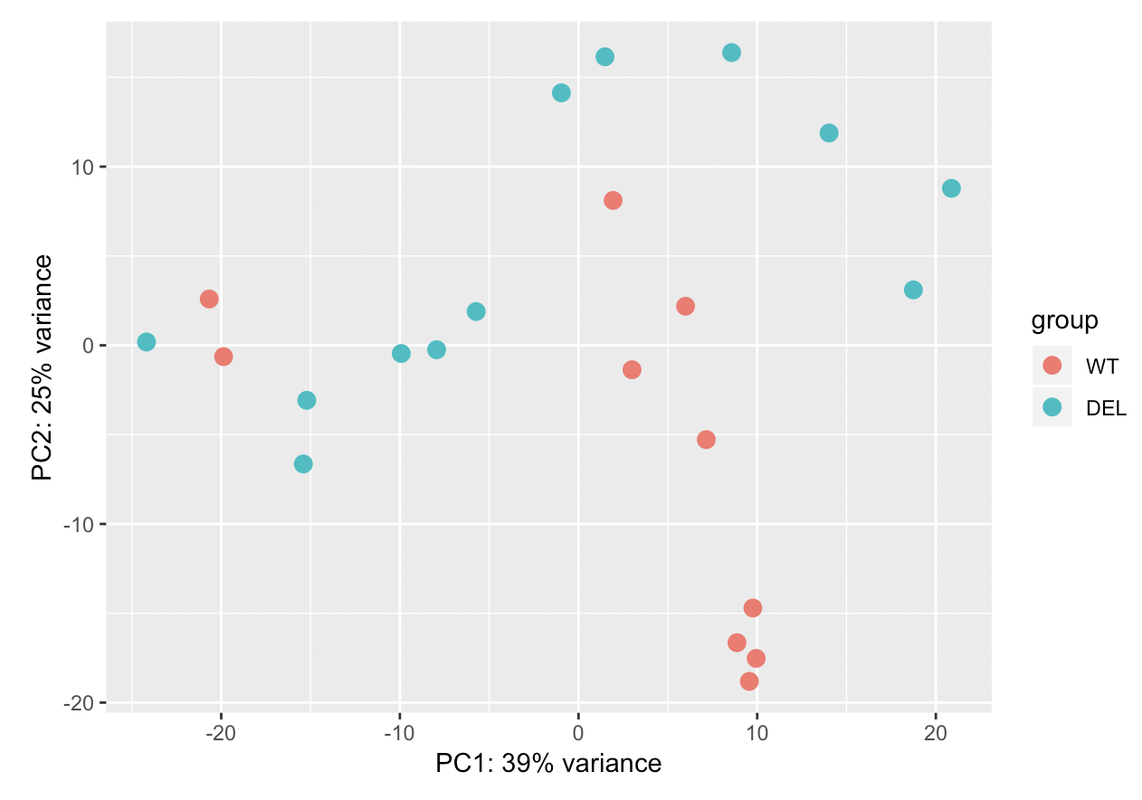
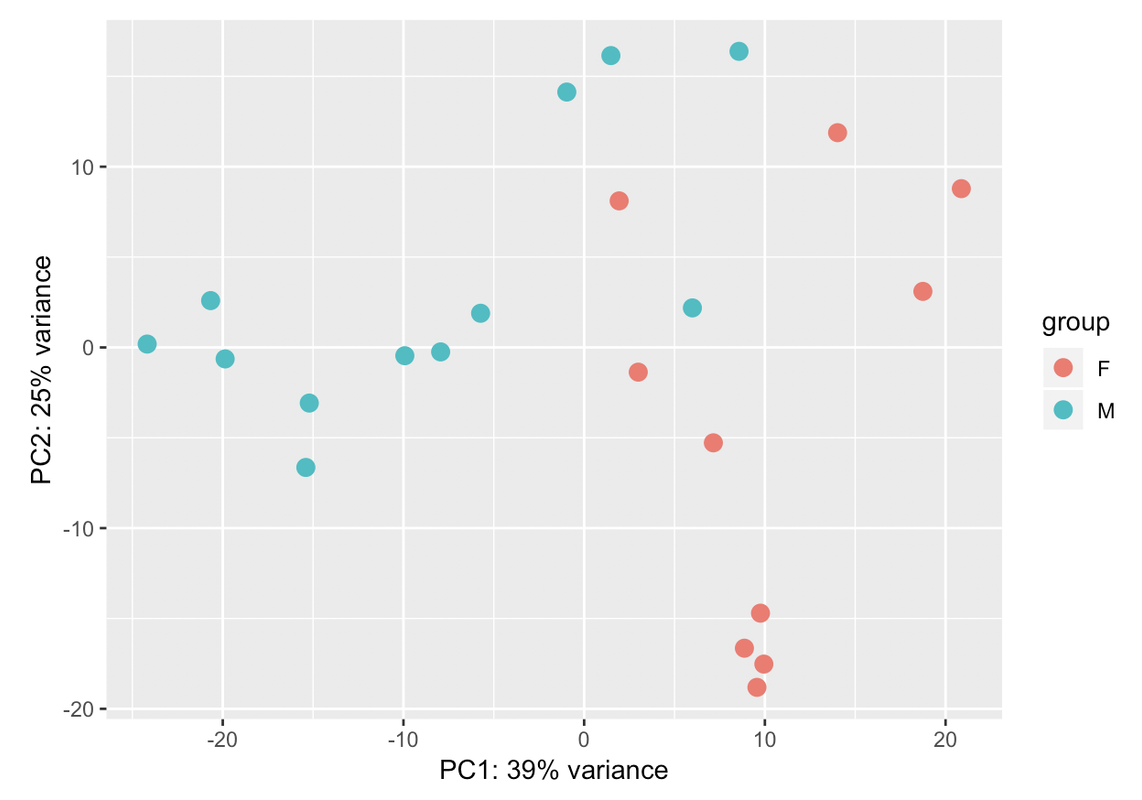
Regarding Sex effects - good point. I referred to it colloquially as a "batch effect" but really what I mean was "factor I think we need to control for when calculating differentially expressed genes." Our study has both male and female samples in both Genotypes, but the Ns aren't even - one Genotype condition has more females. Based on existing literature, I don't think this genotypic aberration should affect sex-linked gene transcription at all. However, if I only do my study with the study design "~Genotype", the differential expression gene list has many X-linked genes - presumably due to the difference in the number of females in one group. Furthermore, when I cluster the rlog-normalized expression data, the samples cluster much better by Sex and less well by Genotype. This leads me to believe that the Sex effect is something that we'd need to 'correct' for in order to get to the real signal, which is how Genotype affects transcription. That's my rationale for including Sex as a "known batch effect."
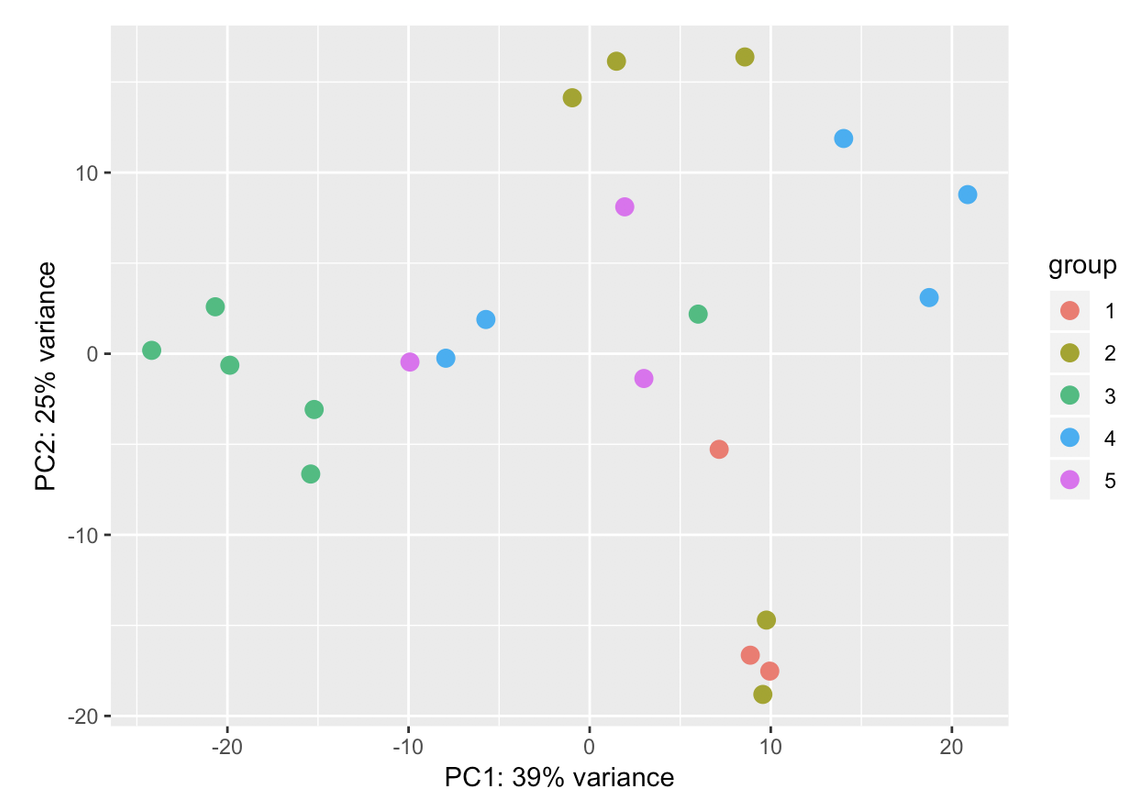
I always go for the explicit when I have the confounding factors measured. Explicit model means you know the batch variables and where they are most likely from and solving the model will tell you how much they are each contributing. In hidden models, you just get a bunch of blobs which you need to dig out what they mean exactly by correlating with known factors.
I also have problems in detecting if the model I have is good as it is
~ sex + conditionor if there is any batch in the data. What it makes me feel a bit confused is the % variance I am obtaining in the PCA plot. Could you help me?Thanks
Ciao teresa. I moved your question to a comment. In your PCA bi-plot, the percent variation on PC1 is relatively low (relative to the amount of variation expected with a batch effect, which could be up to 80%); however, the form of the 2 'strata' of samples looks too consistent for it to be based on just natural biological variation. You could try to colour the samples based on other metadata that you have in an attempt to identify a logical reason behind the finding.
Those two groups are separated by gender. When I colour the samples based on it the samples cluster perfectly into both groups: male and female. That's why I have used gender in the design. But I dont know if that is sufficient for the design. I have a question: adding another variable the % assigned would increase? In case that the design is ok with those two variables, would it be a problem presenting that PCA with so low variance in the results?
Thanks a lot Kevin.
This is the resulting plot
I show you the code that I am using in R:
Would this be right?
I am not using rlog because I have 110 samples and it spends a lot of time so I turned to use vst that I have read it is faster.
The above plot was done with that code. I have always plotted the PCA with this code. So, do you think that this design is valid or do I need to add more variables?
In talking with a colleague (Devon), this type of segregation based on gender would be observed when the condition of interest itself has a weak effect. So, based on this, the assumption is that you may not see many statistically significant genes when you go forward to do differential expression analysis. It is still a good idea, generally, to include
sexin the design formula though.Conversely, if your condition of interest is known to have different pathology / pathobiology between male and female, then that is an explanation too.
There may also be other, unknown biases in the data; however, the % variation on PC1 is actually quite small, at 19%.
So, proceed, but keep in mind this finding.
Dear kevin,
Sorry for the delay in my response. Thanks for the explanation. I have proceeded with this design and I have obtained 226 DE genes. Is this number too high as we should expect? Thanks!
It seems okay. What is the range of P values? Any genes that support your hypothesis(es)?
Dear Kevin,
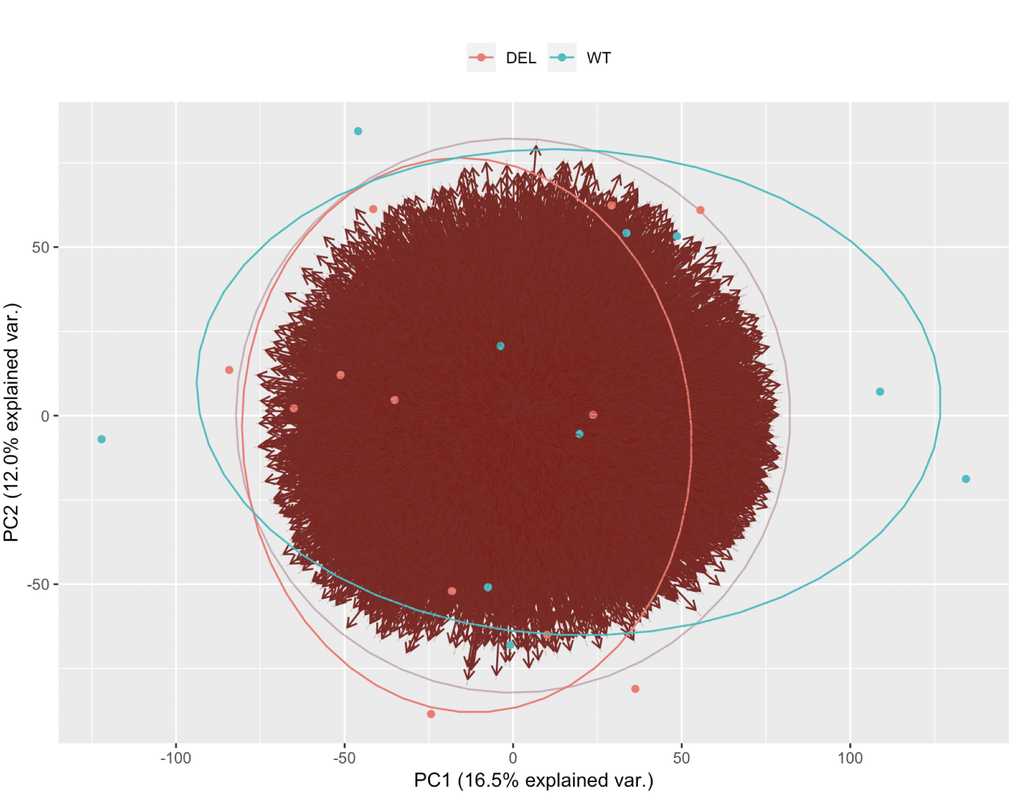
Some genes supported the hypothesis as we expected. Nevertheless, I would like to ask you if it would be a good idea separating the dataset by gender. Firstly, I would study only males from both conditions using the design ~condition. The same for females. I dont know if this is posible. The PCA I have obtained from studying only males from both conditions is this one:
I cant see the two groups, what do you advice me to do?
If you already found genes that are in line with your hypothesis, then that's good. If you divide the dataset into male and female and process them independently, then [hopefully], you would see the same results.
I note that the PC1 % variation in your 'male' plot (just above) is greater than the PC1 % variation in your 'male + female' plot. I think that the conclusion is that gender is not actually a major influence in your dataset.
Hi Kevin,
I have continued with the pipeline in the male dataset only using condition in the design and I have obtained about 1000 DE genes in the male dataset.
There is a lot of difference compared to the DE genes that I obtained when using the male and female dataset joint (about 100 DE genes). So I think that separating the dataset by gender is not a good idea but I am not able to know the reason.
How can I deal with gender in my analysis?
Thanks a lot
Is there any reason why gender would have an influence on the disease that you are studying? Is there any possibility that male and female samples were collected and / or processed differently in your study?
The best way is to keep it (
gender) is as a covariate in your design formula. When you did that, the % variation along PC1 was 19%, which is not extra-ordinary, but is not miniscule, either.I have plotted the heatmap using the dataset where I keep gender as a covariate and the top DE genes are very highlighted...
One of these genes is PRKY which I have read in the literature:
As I am studying a neurodegenerative disorder, could it make sense?
In the other thread I used the batch variable because I thought I had a batch in my dataset but I have realized that I do not have any batch.
I have used another script now to generate the heatmap as you can see here:
I cant see any type of clustering of my samples by the condition of interest..
It does not appear to be a clear division between your condition of interest; however, there is definitely a higher concentration of green in the cluster on the left in the dendrogram. That may be statistically significant.
You could take those statistically significant genes and reduce them further via, for example, stepwise regression or regularised regression (e.g. lasso-penalsied regression), and then perform ROC analysis.
Were you expecting a clear division between your conditions? It may simply not exist for your disease of interest.
Hi Kevin, in regards to the option
blind=FALSEI wish to know what effect will it have if turned true. I was attending RNASeq course on datacamp which recommends to turn it to true to make the vst/rlog blind to the information provided in sampleTable for QC purposes.Is there a very tempting reason, to keep it False, or either which ways.
Hi,
His name is
Kevin, notKelvin. These details are critical to etiquette, so please pay attention to them.Sure.Will remember. Thanks!!
Thanks Kevin for providing clarity.