Entering edit mode

5.8 years ago
jeongmeani
•
0
Hi
I have to make Heatmap using microarray data. this data have about 10,000 genes so the figure i made is large that size is 500*35000. the number of samples are 6.
but the column name(sample name) of figure is cut .
my code is
heatmap2(as.matrix(heatmap_input[,c(2:ncol(heatmap_input))]),,trace="none",scale=zscore,lhei=c(1,5),lwid=cf(0.5,4),margins=c(2,10)cexRow=0.5,cexCol=0.9,)
and image is below.
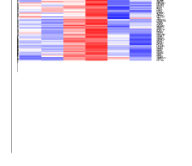
Please help me.

You missed a comma before
cexRowand I don't think the one aftercexCol=0.9is needed.Try to play with
notecex,cexRowandcexColYou want to display 10 000 genes on a single heatmap ? It's ambitious