I am having trouble adding the GO accession numbers on the left hand side of this graph. They match up with the GO descriptions found on the right hand side of the Heatmap. I thought I could use the text function, seen after the Heatmap.2 function, to annotate them, however it doesn't work.
If anyone has any suggestions to do this via R I would be very grateful!
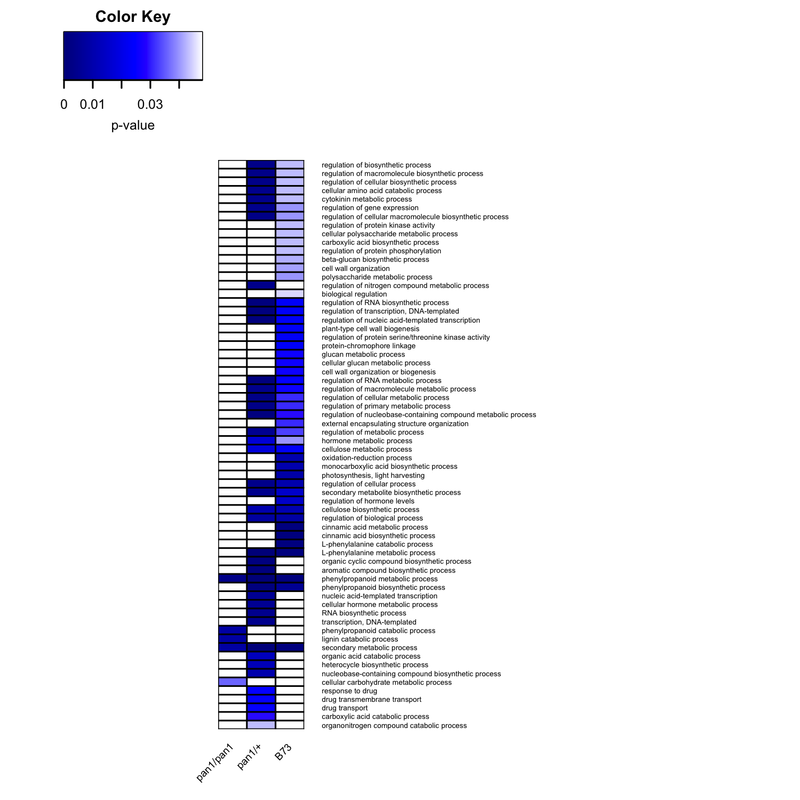
png("BPheatmaps_in_r.png",    # create PNG for the heat map
    width = 5*300,        # 5 x 300 pixels
    height = 5*300,
    res = 300,            # 300 pixels per inch
    pointsize = 8)        # smaller font size

heatmap.2(BPmat_data,
           col = c(colorpanel(1,"white","white"), colorpanel(700,"darkblue","blue","white")),
           margins = c(4, 28),
          dendrogram = 'none',
           trace = 'none',
           lhei = c(2, 8), #plot layout
           scale = c("none"),
           symbreaks = min(BPmat_data, na.rm=TRUE),
           cexRow = 0.5, cexCol = 0.7,
           density.info = "none",
           sepcolor = colorpanel(1,"black","black"),
           sepwidth=c(0.0001,0.0001),
          key.xlab = "p-value",
          colsep=0:ncol(BPmat_data),
          rowsep=0:nrow(BPmat_data),
          srtCol=45)
          get.uni <- !duplicated(BP$GO_Term)
text(x =5, y = seq(0.2,1.2, by=(1/nrow(BPrnames))),
     labels = BP$GO_Term[get.uni],
     las = 2, col = "#000000", cex = 0.4, xpd = TRUE)
dev.off
1 answer
This can be done with mtext(), and by having enough patience to position the labels correctly.
Generate random data and plot it:
dm <- matrix(rexp(200, rate=.1), ncol=20)
rownames(dm) <- paste("Gene", c(1:nrow(dm)), sep=" ")
colnames(dm) <- paste("Sample", c(1:ncol(dm)), sep=" ")

heatmap.2(dm, col=terrain.colors(30), dendrogram="none", trace="none")
Create a label to pass to mtext()
extraLab <- paste("Extra Label", c(1:nrow(dm)), sep="", collapse="\n\n")
extraLab
[1] "Extra Label1\n\nExtra Label2\n\nExtra Label3\n\nExtra Label4\n\nExtra Label5\n\nExtra Label6\n\nExtra Label7\n\nExtra Label8\n\nExtra Label9\n\nExtra Label10"
Add with mtext():
mtext(extraLab, side=2, las=2, adj=-0.35, padj=0.67, font=3, cex=1.1)

The positioning of the labels can be done via a combination of side, adj, padj, and the cex itself. Here, I've passed a single string with end-line characters, but you have the option to just call mtext() multiple times with each separate label, if you wish.
By the way, ComplexHeatmap package would allow you to do this easily by having rownames on one side and then text-based annotation on the other.
Kevin
Log in to answer this question.
Please read the how to on adding images: How to add images to a Biostars post