R package to plot mutational frequency
2
2
Entering edit mode
6.6 years ago
U ▴ 70

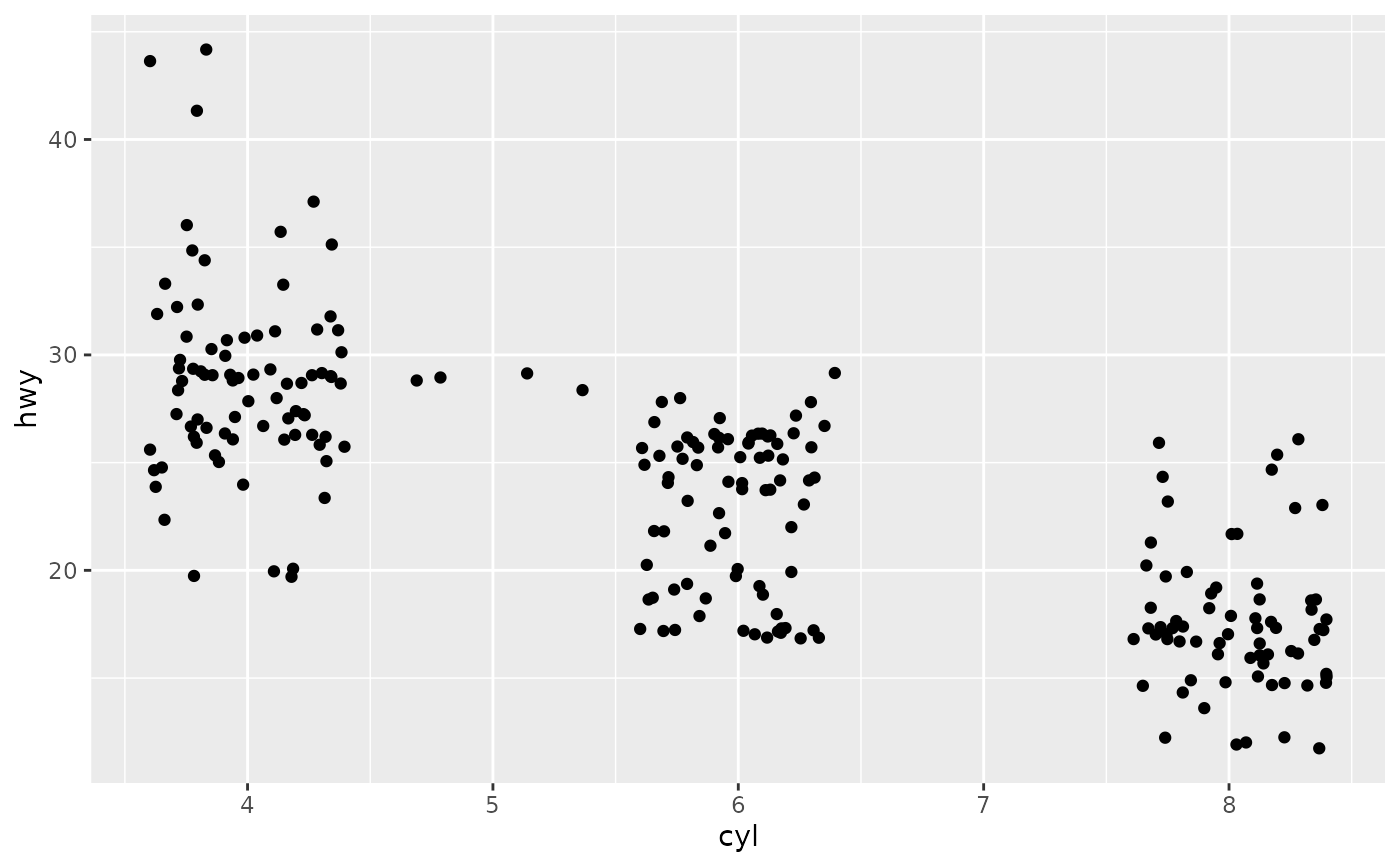
Does anyone know the R or python package used to produce an image as given below. I would like to plot tumor frequency models. Thanks

Mutational burden plot

R rna-seq next-gen • 3.4k views
ADD COMMENT
0
Entering edit mode
6.6 years ago
igor 13k

I don't know if there is a package for that, but you can use ggplot geom_jitter to do something similar. It's not the same, but it will let you see the distribution of the individual values.

enter image description here

ADD COMMENT

Login before adding your answer.

Traffic: 1070 users visited in the last hour
Help About
FAQ
Access RSS
API
Stats

Use of this site constitutes acceptance of our User Agreement and Privacy Policy.

Powered by the version 2.3.6