I have a list of snps in .txt format. only 10 snps to be exact, that appear on a certain region on chromosome 7. In my text file, I have the position of the SNP and the values I need, I just have to create the zoomed-in effect like in the picture below.
I 'm using GViz, to plot the Ideogram of the chromosome, and then zoom in to the specific region in order to list the SNPs and the info I have from a study next to them.
I'm looking for something like this: (I made a draft using Preview)

I have managed to recreate the ideogram of the chromosome and I'm struggling with the SNPs. Can anyone help?
1 answer
You can do this with karyoploteR in combination with ggplotify and cowplot.
You'll have to create two independent karyoplots (here contained in two functions) and use ggplotify and cowplot to combine them into a single image.
The first karyoplot is just the chromosome ideogram with the rectangle for the zoomed-in region and the second one is the one with the actual data. In the second one you can plot rectangle representing SNPs, but you can also plot any other data or annotations using other karyoploteR functions
In any case, here's the code
library(karyoploteR)
library(ggplotify)
library(cowplot)

snps <- toGRanges(c("chr7:21e6-21e6", "chr7:21.2e6-21.2e6", "chr7:21.4e6-21.4e6"))
snps$name <- c("rs0002", "rs0004", "rs0006")
#Set the height if we don't want them all in the same line
snps$y0 = c(0, 0.5, 0)
snps$y1=c(0.3, 0.8, 0.3)

zoom.reg <- toGRanges("chr7:20.5e6-23e6")


plotChromosome <- function() {
  pp <- getDefaultPlotParams(plot.type = 6)
  pp$topmargin <- 20
  pp$bottommargin <- 20
  kp <- plotKaryotype(chromosomes = "chr7", plot.type=6, plot.params = pp, cex=1.4)
  kpAddBaseNumbers(kp, add.units = TRUE, cex=1.8)
  kpRect(kp, zoom.reg, y0=-0.4, y1=1.4, col=NA, border="red", lwd=2)
}

plotZoom <- function() {
  pp <- getDefaultPlotParams(1)
  pp$bottommargin <- 20
  pp$topmargin <- 20

  kp <- plotKaryotype(zoom=zoom.reg, plot.params = pp, cex=1.8)
  kpAddBaseNumbers(kp, tick.dist = 1e6, minor.tick.dist = 0.2e6, add.units = TRUE, cex=1.4)
  kpRect(kp, snps,  col="steelblue", border="steelblue")
  kpPlotNames(kp, snps, labels = snps$name, pos="left", cex=1.6)
  kpAddLabels(kp, labels = "Selected SNPs", srt=90, pos=3, cex=1.8)
}

png("General_plus_zoom.png", width=1000, height=500)
  p1 <- as.ggplot(expression(plotChromosome()))
  p2 <- as.ggplot(expression(plotZoom()))
  plot_grid(p1, p2, ncol=1, rel_heights = c(1,3))
dev.off()
And this will give you an image like this
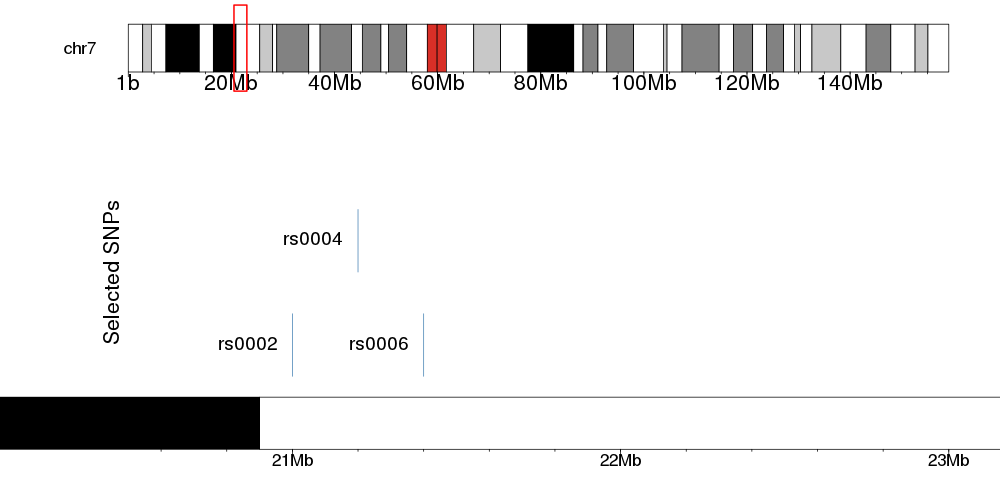
You can improve, modify and customize the image however you want. You can find more information in the karyoploteR tutorial.
Hope this helps
Log in to answer this question.
Hey, did you figure this out? I'm trying to do the same. I found a package called "mapsnp". But it is not available in the current version of R (3.6.1) :(