N-Gram Plots Using Pmc Or Pubmed Abstracts
3
2
Entering edit mode
12.1 years ago

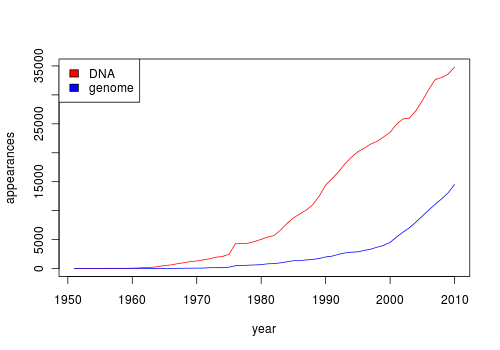
I am looking at a way to visualize distribution of a set of keywords over the years in PubMed. I am sure that there must be a tool to do that. An ideal solution will be similar to Google books Ngram Viewer. Here is an example plot using 2 key words.

alt text

Do you know about such a tool ? Please share !

text data visualization • 5.3k views
ADD COMMENT
1
Entering edit mode

This may be due to i) wrong publication date assigned to some google books entries ii) default smoothing of the graph. This is the case for a "peak" of 'bioinformatics' term use around year 1900 :-)

ADD REPLY
0
Entering edit mode

I think this is a great question but as a geneticist, I am puzzled by one aspect of that graph. It appears that google is showing citations for the word "gene family" before the word "gene" was coined. I can't think of a reason for this but it may be something to keep in mind when doing these searches.

ADD REPLY
0
Entering edit mode

SES & Jan thanks. I know the Google n-gram plot is not correct from a scientific context and this specific example have lot of false positive and low specificity :). The words could have come from different contexts, not exactly biology. You can click on the interval link given in that page to see the corresponding books that have these keywords.

ADD REPLY
0
Entering edit mode

Another issue with the Google data is incorrect values due to OCR errors (conversion of scanned documents to text). Frankly, I'm amazed at how little attention many people pay to n-gram data quality; it seems they are dazzled by the "big data" aspect.

ADD REPLY
3
Entering edit mode
12.1 years ago
dimkal ▴ 730

Nothing particular comes to mind aside from searching PubMed and downloading all the citation in CSV format, extracting the column with all the years into 'years.txt' and then running the following linux scripts:

sort -n years.txt | uniq -c

This will give you a count how many citings you have in a year. I did this few months back for the word "metadynamics" and I got the following plot (plotted in libreoffice.org).

alt text

ADD COMMENT
0
Entering edit mode

Thanks dimkal, this is helpful.

ADD REPLY
0
Entering edit mode

Thanks dimkal, this is helpful. I am specifically interested in an n-gram style plot from a text-mining perspective. Wanted to know how my key-words of interests are compare to other keywords in PMC full-text or PubMed abstracts

ADD REPLY
3
Entering edit mode
12.1 years ago

Do you need full-text search? If you're content with just title and abstract, Neil has you covered. If you have trouble with his examples, I've tweaked his code to do similar things (see below) and may be able to help.alt text

ADD COMMENT
0
Entering edit mode

Thanks Chris, this is nice. Are you suppose add any code in the answer ? I am specifically interested in an n-gram style plot from a text-mining perspective. Wanted to know how my key-words of interests are compare to other keywords in PMC full-text or PubMed abstracts.

ADD REPLY
0
Entering edit mode

Neil's site (that I linked to) has the basic code you'll need (some Ruby and some R).

ADD REPLY
0
Entering edit mode

Thanks for the link, Chris.

ADD REPLY
3
Entering edit mode
12.1 years ago
B. Arman Aksoy ★ 1.2k

Although it works on Arxiv, here's a recently published tool that might be of interest to you: http://arxiv.culturomics.org/

and related news on NYtimes: http://www.nytimes.com/2012/03/25/business/words-by-the-millions-sorted-by-software.html?_r=1&src=tp

ADD COMMENT
0
Entering edit mode

Thanks Arman, this is a nice tool to look the prevalence of keywords in "Quantitative Biology" articles in Arxiv.

ADD REPLY

Login before adding your answer.

Traffic: 1976 users visited in the last hour
Help About
FAQ
Access RSS
API
Stats

Use of this site constitutes acceptance of our User Agreement and Privacy Policy.

Powered by the version 2.3.6